Yeti, Inc. reported profits on an adjusted basis rose 19 percent in the fourth quarter on January 2 on an 18 percent revenue gain. The cooler-maker became the latest vendor to warn about supply-chain headwinds for 2022. Sales for 2022 are expected to increase between 18 percent and 20 percent, with growth weighted toward the second half.
Matt Reintjes, president and chief executive officer, commented, “2021 was an incredible year for Yeti, achieving several milestones during our fourth year as a public company. Today we are reporting nearly 30 percent net sales growth, adjusted operating margin expansion to approximately 21 percent and balance sheet strength with over $300 million of cash on-hand. We drove demand across our omnichannel with 35 percent growth in our DTC business, delivered strong performance in both our product categories of drinkware and coolers and equipment and approached a 10 percent international sales mix. This performance was capped by fourth-quarter net sales growth of 18 percent, exceeding the high-end of our outlook despite the many supply chain challenges facing the entire industry. Looking forward, as we continue to maneuver through the varied supply chain disruptions and pressures, I remain incredibly confident in the demand for the Yeti brand.”
For The Three Months Ended January 1, 2022
(13 Week Period)
- Net sales increased 18 percent to $443.1 million compared to $375.8 million during the same period last year.
- Direct-to-consumer (DTC) channel net sales increased 21 percent to $263.9 million compared to $217.8 million in the prior-year quarter, driven by strong performance in its Drinkware and Coolers & Equipment. The DTC channel grew to 60 percent of net sales compared to 58 percent in the prior-year period.
- Wholesale channel net sales increased 13 percent to $179.2 million compared to $158.0 million in the same period last year, primarily driven by Drinkware.
- Drinkware net sales increased 21 percent to $285.6 million compared to $235.7 million in the prior-year quarter, primarily driven by the continued expansion of our Drinkware product offerings, including the introduction of new colors and sizes, and demand for customization.
- Coolers & Equipment net sales increased 13 percent to $151.6 million, compared to $134.3 million in the same period last year, driven by strong performance in bags, outdoor living products, hard coolers and soft coolers.
- Gross profit increased 13 percent to $254.8 million, or 57.5 percent of net sales compared to $224.8 million, or 59.8 percent of net sales, in the fourth quarter of 2020. The 230 basis point decrease in gross margin was primarily driven by higher inbound freight rates, the unfavorable impact of the non-renewal of the Global System of Preferences (GSP) program on import duties and product input cost inflation, partially offset by lower inventory reserves.
- Selling, general and administrative (SG&A) expenses increased 12 percent to $161.1 million, compared to $143.4 million in the fourth quarter of 2020. As a percentage of net sales, SG&A expenses decreased 190 basis points to 36.3 percent from 38.2 percent in the prior-year period, primarily driven by lower planned marketing expenses, partially offset by higher variable expenses.
- Operating income increased 15 percent to $93.7 million, or 21.2 percent of net sales, compared to $81.4 million, or 21.7 percent of net sales during the prior-year quarter.
- Adjusted operating income increased 18 percent to $99.8 million, or 22.5 percent of net sales, compared to $84.5 million, or 22.5 percent of net sales during the same period last year.
- Net income increased 17 percent to $72.9 million, or 16.4 percent of net sales, compared to $62.4 million, or 16.6 percent of net sales in the prior-year quarter. Net income per diluted share increased 15 percent to $0.82, compared to $0.71 per diluted share in the prior-year quarter.
- Adjusted net income increased 19 percent to $77.4 million, or 17.5 percent of net sales, compared to $65.2 million, or 17.4 percent of net sales in the prior-year quarter. Adjusted net income per diluted share increased 18 percent to $0.87, compared to $0.74 per diluted share in the prior-year quarter.
Adjusted earnings of 87 cents a share topped Wall Street’s consensus estimate of 74 cents. Sales of $443.1 million were slightly above analysts’ consensus of $442.2 million.
For The Twelve Months Ended January 1, 2022
(52 Weeks)
- Net sales increased 29 percent to $1,411.0 million compared to $1,091.7 million in the prior year.
- DTC channel net sales increased 35 percent to $784.7 million, compared to $580.9 million in the prior-year period, driven by Drinkware and Coolers & Equipment. The DTC channel grew to 56 percent of net sales, compared to 53 percent in the prior year.
- Wholesale channel net sales increased 23 percent to $626.3 million compared to $510.9 million in the same period last year, primarily driven by Drinkware and Coolers & Equipment.
- Drinkware net sales increased 32 percent to $832.4 million, compared to $628.6 million in the prior-year period, due to the continued expansion of our Drinkware product offerings, including the introduction of new colorways and sizes, and strong demand for customization.
- Coolers & Equipment net sales increased 24 percent to $551.9 million compared to $446.6 million in the same period last year. The performance was driven by growth in bags, outdoor living products, soft coolers, and hard coolers.
- Gross profit increased 30 percent to $816.1 million, or 57.8 percent of net sales, compared to $628.8 million, or 57.6 percent of net sales in the prior year. Improvements in gross margin of 210 basis points were primarily driven by lower inventory reserves as well as a favorable mix shift to our DTC channel and product cost improvements, largely offset by 190 basis points of contraction primarily driven by higher inbound freight rates and the unfavorable impact of the non-renewal of the GSP program on import duties.
- SG&A expenses increased 31 percent to $541.2 million, compared to $414.6 million in the prior year. The 2020 period included the benefit of cost reduction initiatives implemented in response to COVID-19. As a percentage of net sales, SG&A expenses increased 40 basis points to 38.4 percent from 38.0 percent in the prior-year period. This increase was due to an increase in variable expenses, driven by the increased mix of our faster growing and higher gross margin DTC channel coupled with higher marketing expense.
- Operating income increased 28 percent to $274.9 million, or 19.5 percent of net sales, compared to $214.2 million, or 19.6 percent of net sales during the prior year.
- Adjusted operating income increased 32 percent to $295.1 million, or 20.9 percent of net sales, compared to $224.3 million, or 20.5 percent of net sales during the same period last year.
- Net income increased 36 percent to $212.6 million, or 15.1 percent of net sales, compared to $155.8 million, or 14.3 percent of net sales in the prior year. Net income per diluted share increased 36 percent to $2.40, compared to $1.77 per diluted share in the prior year.
- Adjusted net income increased 39 percent to $227.8 million, or 16.1 percent of net sales, compared to $164.2 million, or 15.0 percent of net sales in the prior-year period. Adjusted net income per diluted share increased 37 percent to $2.57, compared to $1.87 per diluted share in the same period last year.
Balance Sheet and Cash Flow Highlights
- Cash increased to$312.2 million, compared to $253.3 million at the end of Fiscal 2020.
- Inventory increased 128 percent to $318.9 million, compared to $140.1 million at the end of Fiscal 2020, primarily due to the intentional inventory purchase order reductions taken during 2020 in response to COVID-19. Also, inventory was impacted by higher in-transit inventories in Fiscal 2021 due to extended lead times from ongoing supply chain disruptions, as well as the impact of higher inbound freight costs. The inventory increase represents a CAGR of 31 percent since the same period in 2019 compared to our net sales CAGR of 24 percent from full-year 2019 to full year 2021.
- Total debt, excluding finance leases and unamortized deferred financing fees, was $112.5 million, compared to $135.0 million at the end of Fiscal 2020. During Fiscal 2021, Yeti made mandatory debt payments of $22.5 million. At the end of Fiscal 2021, our cash balance exceeded the total debt by $199.7 million.
Fiscal 2022 Outlook
Reintjes concluded, “Our strategic focus is unchanged in 2022, as we will continue to broaden reach and awareness of the brand, deliver uncompromising innovation, enhance and optimize our digital capabilities and expand our channel reach to scale internationally. Our net sales outlook of 18 percent to 20 percent growth is solidly above the high end of our long-term target. It reflects our strong conviction in our product pipeline, the opportunity to fulfill robust demand, and the ability to engage our global consumer. Despite the expectation of significant supply chain cost headwinds throughout the year, we remain focused on prioritizing strategic investments to support the long-term sustainable growth of the Yeti brand.”
For Fiscal 2022, Yeti expects:
- Net sales to increase between 18 percent and 20 percent, with sales growth weighted to the second half of the year;
- Operating income, as a percentage of net sales, of approximately 18.5 percent, and operating income to increase between 13 percent to 15 percent;
- Adjusted operating income, as a percentage of net sales, of approximately 20 percent, and adjusted operating income to increase between 13 percent to 15 percent;
- An effective tax rate of approximately 24 percent (versus 21.8 percent in the prior-year period);
- Net income per diluted share between $2.62 and $2.67, reflecting a 9 percent to 11 percent increase, with earnings growth weighted to the second half of the year;
- Adjusted net income per diluted share between $2.82 and $2.86, reflecting a 10 percent to 11 percent increase, with earnings growth weighted to the second half of the year;
- Diluted weighted average shares outstanding of approximately 88.9 million; and
- Capital expenditures of approximately $60 million primarily to support investments in technology and new product innovation and launches.
The adjusted EPS guidance is below Wall Street’s consensus estimate of $2.93, although sales guidance in the range of 18 percent and 20 percent is above Wall Street’s consensus estimate of 15.9 percent.
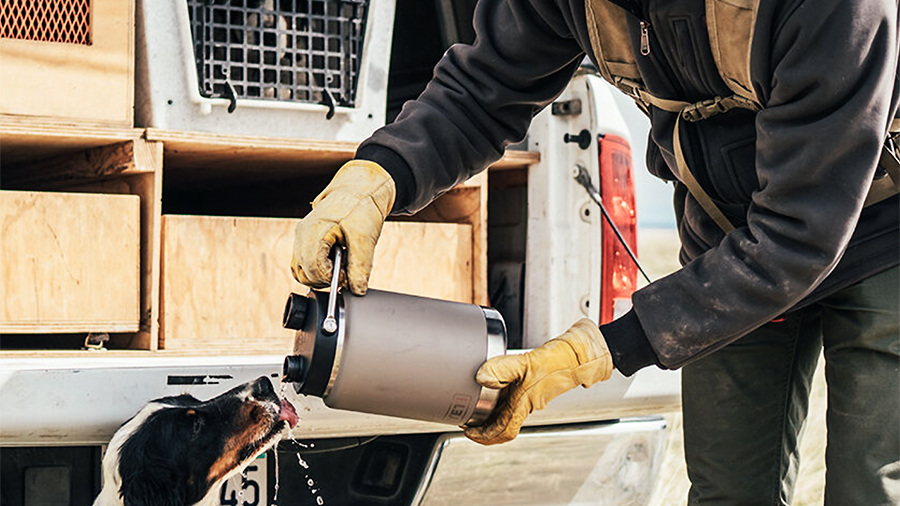
Photo courtesy Yeti (shown: Yeti Rambler Half-Jug, Yeti Sharptail Taupe Color Collection)


