By Eric Smith
Activity level trends saw a continued shift from core participation to casual participation across many sports last year, according SFIA’s 2017 Sports, Fitness and Leisure Activities Topline Report.
Over the last five years, casual participation has grown 3.2 percent, on average, while core participation has declined 2 percent, on average. On the surface, that is concerning for an industry that benefits from higher frequency among participants, according to SFIA President & CEO Tom Cove.
Core participants are more dedicated to their sport and more likely to continue participating year after year. That equals stronger sales for sports & fitness businesses.
“Core is what pays the bills,” Cove said. “Core participants buy new technology. They’re attuned to what we’re selling in new and improved product. They’re more committed to travel for their sport, and they’re more willing to spend on equipment and other costs related to the sport.”
There is a silver lining in this continued shift, however. Growth in casual participation could signal increased exposure to a variety of sports, such as grassroots baseball and basketball organizations adjusting their rules to grow in areas where they haven’t been able to get a foothold, or a bevy of new outreach programs that introduce kids to skiing and snowboarding.
“Casual could be good if it’s entry to market … and can grow into core,” Cove said. “The key there [is] for our industry and the sports development universe to take those kids being exposed at a casual level and give them a pathway to becoming core players. That’s what the cutting edge of the next few years is going to be.”
Higher casual participation could also signal that members of younger generations want to try out a lot of different sports without self-identifying as part of just one and could increase in activity without immediately ascending to core level.
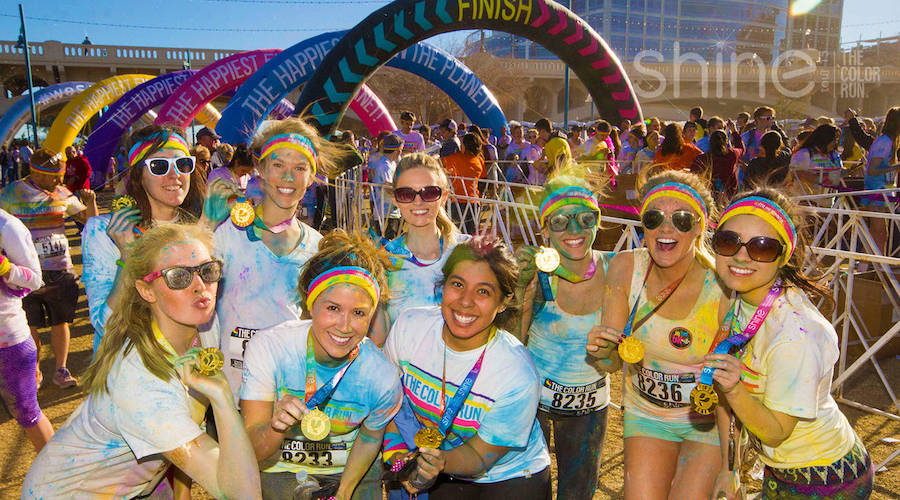
Millennials and Gen Z have the lowest percentage of inactivity among the generations, so paying attention to their participation habits will be critical, even if they differ from baby boomers and Gen Xers. For example, younger runners may not want to run marathons as much as their elders, but they are more likely to engage in fun runs and will likely want to network on social media while participating.
“You’ve got to go where the consumer is, and you’ve got to deliver what the consumer wants,” Cove said. “Things that get in the way will get in the way of sales and profits, and things that connect are going to improve sales and profits. It’s not valuable to lament why people are doing these things. “Our companies should be facilitating those things that inspire people to be active and the products that do that are going to be more well-received than the products that don’t.”
Here are some of the key participation statistics by category for 2018:
Aerobic Activities – Running/jogging made a comeback in 2017, with a 7.1 percent increase in total participation and 10.3 percent annual growth in casual participation. Cardio kickboxing saw the biggest decline, with 3 percent fewer participants in 2017 year over year.
Conditioning Activities – Rowing machine participation topped this category at 8.1 percent annual growth, while bodyweight exercise & bodyweight accessory-assisted training was down 2.6 percent year-over-year.
Strength Activities – Kettlebell users were the clear winner among strength activities, with 13.4 percent growth in total participation. All other activities – free weights (barbells), free weights (dumbells/hand weights) and weight/resistance machines – also registered growth last year.
Individual Sports – Boxing for competition led the individual sports category at 13 percent annual growth in 2018. Adventure racing saw a sharp decline, losing 15.7 percent of its total participation last year compared to 2016.
Racquet Sports – Pickleball dominated this category with an 11.3 percent jump in total participation. (Click here for recent news about this growing sport.) Badminton saw the biggest drop-off, falling 12.6 percent in total participation and 13.6 percent in casual participation year over year.
Team Sports – Football (flag) narrowly took top honors in this category, with 6.1 percent total participation growth in 2017 compared to the previous year. Volleyball (grass) was among many sports that saw steep declines; it dropped 19.6 percent year over year.
Outdoor Sports – “The interest in activities has started moving toward outdoor recreation,” claimed the SFIA report. This trend showed up with growth across many sports, but bicycling (BMX) was the big winner at 9.9 percent growth year-over-year. Climbing (traditional/ice/mountaineering) was down 9.4 percent compared to 2016.
Water Sports – Kayaking (recreational) led this category at 5.2 percent total participation growth in 2017 compared to the prior year, while boardsailing/windsurfing fell 9.5 percent.
Winter Sports – This category was the overall winner with 2 percent growth across all of its sports. Total participation in skiing (freeski/freestyle) increased 15.5 percent, while telemarking (downhill) fell 11.1 percent, compared to 2016.
The 2018 Sports, Fitness and Leisure Activities Topline Participation Report is available for download at www.sfia.org/reports. The report is free of charge to all SFIA members and is available for purchase by other interested parties.
[author] [author_image timthumb=’on’]https://s.gravatar.com/avatar/dec6c8d990a5a173d9ae43e334e44145?s=80[/author_image] [author_info]Eric Smith is Senior Business Editor at SGB Media. Reach him at eric@sgbonline.com or 303-578-7008. Follow on Twitter or connect on LinkedIn.[/author_info] [/author]


