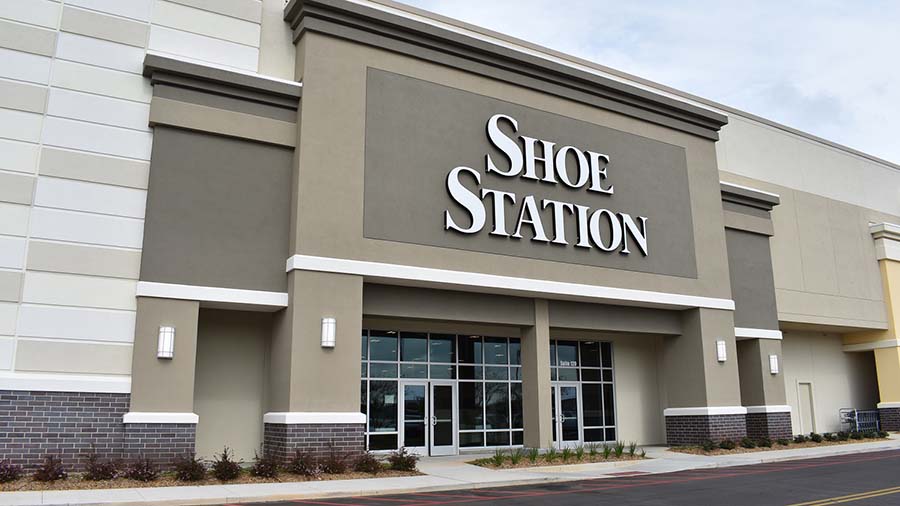
Shoe Station Group, Inc. (SHOE), fka Shoe Carnival, Inc. (SCVL), the parent of the Shoe Carnival and Shoe Station Retail banners, said its second quarter results reflect a footwear marketplace that became increasingly promotional as the second quarter progressed.
“We priced competitively to protect our market position and accelerated the liquidation of aged and excess inventory, both of which pressured our gross profit margin,” advised Cliff Sifford, interim president and CEO. “Sales were further impacted by merchandise assortments that were not fully aligned with the customers shopping our stores. The significant improvement in our fiscal August back-to-school results reflects the better and more localized assortments in athletic footwear.”
SHOE shares were down nearly 20 percent in pre-market trading on Thursday, September 10 but settled back too a mid-single digit percentage decline by midday.
The headline here could have been from Famous Footwear the day before as the family footwear channel, in general, appeared to have a real issue with the second quarter and the back-to-school (BTS) selling season this year that tended to improve in August. Now, it will be all about boots as the retailers attempt to make up lost ground in the back half of the year.
Second Quarter Summary
Net sales for the 2026 second quarter were $284.3 million, compared to $306.4 million in the second quarter of 2025. Comparable store sales declined 7.1 percent year-over-year (y/y), which comes on top of a 7.5 percent comps decline in the year-ago second quarter.
- Shoe Carnival banner net sales declined 6.5 percent y/y to $178.5 million for the quarter, representing 63 percent of total net sales. Comparable store net sales decline of 6.3 percent.
- Shoe Station banner net sales declined 8.4 percent y/y to $105.7 million, representing 37 percent of total net sales. Comparable store net sales declined 8.5 percent.
Sales in both banners were said to be impacted by an increasingly promotional footwear marketplace and by assortments not fully aligned with the customers shopping the stores.
Sifford added more detail to the early morning earnings release on a conference call with analysts.
“First, and this is the issue we identified and discussed with you on our first quarter call, the assortments in our Shoe Carnival and re-bannered Shoe Station stores were not fully aligned with the customers actually shopping those stores,” he explained. “This alignment by location includes brand, assortment, and sizing, all of which were not up to the standards we have set for our stores. When the assortment and sizing based on the customer that shops the store is wrong, promotion cannot fix it.” He said both of these opportunities showed in the company’s Q2 results.
Second, Sifford said the company accelerated the liquidation of aged and excess inventory, a move that was also said to be “deliberate.”
“It pressured merchandise margin in the quarter, but it converted slow-moving inventory into cash and open receipt dollars for our fall assortments,” he added.
When the footwear marketplace became increasingly promotional as the quarter progressed, management made another deliberate choice to price in-season product “competitively” to protect market position “rather than defend margin rate and lose the customer.” The CEO said they were pleased with the customer conversion rate in that effort.
“When customers came in our stores during the quarter, they bought,” Sifford stressed. “Store conversion improved in both banners, rising to levels we have not experienced in years.” However, he said foot traffic declined for the period. “Lower prices alone did not bring customers through the door,” he added.
“Our challenge is clearly traffic and consumer awareness, not price, and that shapes where we need to invest,” the CEO said, in a statement that was probably worth a few percentage points in share price recovery. “We will be communicating our value proposition and our assortment to both the legacy Shoe Carnival customer and the Shoe Station customer. The message will be differentiated, but it will communicate our improved assortment and value proposition. We need to rebuild trust with our customers that our stores offer the best selection of shoes and accessories at a great value for the entire family, and that takes effective and targeted communication, not deeper discounting.”
Sifford went into more detail on the product side of the quarter because he said “the category detail tells you exactly where the assortment work matters and where we believe it is already paying off.”
Adult Athletic, the largest business for SHOE at ~37 percent of sales, declined mid-single digits in the quarter, but he said the story underneath is mixed.
Men’s Athletic was down only about 1 percent, with the Running category comping positive in both men’s and women’s. The underperformance, as the market has seen elsewhere this year, was said to be in Fashion Athletic, including the Basketball category.
“Running shoes are a staple for our customers,” Sifford noted. “They trust us to have the best brands and a broad assortment. When we have the right brands in the right doors, we win. That is a localization thesis in one category.”
Women’s Non-Athletic, which comprises ~23 percent of sales, reportedly declined in the high-single digits, with both Sandals and Women’s Sport Casuals trending down in double digits.
Children’s Shoes declined in the high-single digits for the quarter.
“This is a business that we should own in the Shoe Carnival stores,” Sifford said, with some frustration. “Our family proposition in these stores start with the Children’s business. Our Children’s shoe buyers are as good as it gets in the industry, and they are rebuilding this business back to the levels we have traditionally experienced. This is a huge opportunity for us, and we believe we will once again be the destination shop for kids’ shoes.
Men’s Non-Athletic reportedly declined in the high-single digits in Dress and Casual, while Men’s Work Boots comped up ~2 percent for the period. Sifford called the category is “a replenishment business with a loyal customer.”
“The pattern across all categories is consistent,” he continued. “Replenishment categories performed better. The categories that depend most on having the right localized assortment and sizing structures underperformed. We believe this is fixable, and we are very focused on making that happen.”
The CEO went on to say that the back-to-school season is the first evidence that SHOE’s localized assortment focus is working. “Ahead of the season, we were able to change many distributions to a more localized athletic assortment, the category that drives back-to-school.”
Third Quarter Preview
Back-to-school comparable store sales reportedly “improved significantly” from the second quarter trends, with August comparable store sales down in low-single digits, supported by “improved and more localized assortments.”
Through the four weeks of fiscal August ended August 29, net sales declined 3.3 percent y/y and comparable store sales declined 2.7 percent y/y compared to the four-week fiscal August period in 2025, which SHOE called a “significant improvement” compared to the second quarter comp trend. SHOE reportedly saw improvement in both banners and continued double-digit e-commerce growth.
“The majority of our fall merchandise has been allocated with localized assortments, which we expect to further benefit sales performance, and we believe our boot assortment is outstanding,” Sifford commented, suggesting it was the strongest assortment offered in several years. “We are supporting the fall season with incremental investment in advertising to drive customer traffic and to communicate our value proposition and product offering.”
Sifford said these actions do not change company expectations that the promotional environment will persist through the balance of the year, and stressed that the company’s updated guidance reflects that environment.
“We believe communication is the missing element,” he concluded.
Profitability & Expenses Summary
Gross profit margin in the second quarter was 31.9 percent of net sales, a decrease of 690 basis points compared to the second quarter of 2025, reflecting increased promotional activity, liquidation of aged and excess inventory, and the prior-year benefit from raising prices in advance of tariff-related cost increases.
- Merchandise margin decreased 630 basis points y/y. Merchandise margin in the second quarter of 2025 included a temporary benefit from raising prices in advance of increasing tariff-related costs. In the second quarter of 2026, merchandise margins were also said to be impacted by increased promotional activity and product liquidation.
Company CFO Kerry Jackson said the merchandise margin decline reflects three drivers:
-
- The second quarter of last year included a temporary benefit from rising retail prices ahead of tariff-driven cost increases while selling through inventory purchased at pre-tariff costs, a benefit that did not repeat.
- The company priced competitively in an increasingly promotional marketplace, which lowered average transaction size.
- The company accelerated the liquidation of aged and excess inventory, accepting margin dilution in exchange for inventory quality.
- Although buying, distribution and occupancy costs decreased compared to the second quarter of 2025, due to lower net sales, these costs reduced gross profit margin by 60 basis points.
Selling, general and administrative expenses (SG&A) decreased $10.6 million compared to the second quarter of 2025. As a percent of net sales, SG&A for the second quarter of 2026 was 29.2 percent as compared to 30.6 percent in the second quarter of 2025. The lower SG&A was reportedly driven by lower selling costs, primarily advertising and other re-banner-related expenses, and lower performance-based compensation.
Income tax expense in the second quarter of 2026 was $2.3 million and the effective tax rate in the second quarter of 2026 was 26.7% compared to 25.9 percent in the second quarter of 2025.
Net income for the second quarter was $6.3 million, or 23 cents per diluted share, compared to net income of $19.2 million, or 70 cents per diluted share, in the second quarter of 2025.
Balance Sheet Summary
Cash, cash equivalents, and marketable securities amounted to $131.6 million at quarter-end, an increase of $39.7 million compared to the 2025 second quarter-end.
Jackson said inventory ended the quarter at $426.6 million, down $22.4 million, or down 5.0 percent year-over-year. Inventory per store was said to be down 3.6 percent y/y. The overall reduction was reportedly “achieved deliberately through the accelerated liquidation of aged and excess inventory” Jackson said they remain on plan for an approximately $50 million reduction in inventory by fiscal year-end.
SHOE enters the second half with no debt outstanding with $99 million currently available under a $100 million credit facility, which Jackson said they expect to renew or replace in the second half of fiscal 2026.
Tariffs
Following the Supreme Court’s February rule striking down certain tariffs imposed under IEEPA, the company submitted initial tariff refund claims in July and expect to file additional claims in the second half of fiscal 2026.
“We expect these claims to total approximately $1.2 million, and we will record refunds when collected,” Jackson added.
Stores
The company re-bannered 20 Shoe Carnival stores into Shoe Station stores during the quarter, marking 21 total re-banners year-to-date in fiscal 2026. The company said it does not expect to re-banner any additional stores for the remainder of the fiscal year.
Outlook
Shoe Station Group is adjusting its previously communicated fiscal 2026 guidance. The company now expects:
- Net sales of $1.100 billion to $1.111 billion for the fiscal year, representing a decline of approximately 2 percent to 3 percent versus fiscal 2025, inclusive of comparable store sales for the second half of fiscal 2026 in a range of down 1 percent to up 1 percent;
- GAAP EPS in the range of 32 cents to 47 cents per share and Adjusted EPS of 75 cents to 90 cents per share;
- Gross profit margin of approximately 32.5 to 32.7 percent, representing approximately 390 to 410 basis points of compression versus Fiscal 2025;
- GAAP SG&A approximately flat versus fiscal 2025 and a reduction in Adjusted SG&A of approximately $14 million versus fiscal 2025, inclusive of incremental advertising investment supporting the fall and holiday seasons; and
- A GAAP tax rate of approximately 37 percent and an Adjusted Tax Rate of approximately 27 percent.
The company’s Adjusted EPS, reduction in Adjusted SG&A and Adjusted Tax Rate guidance excludes the $13.6 million of non-recurring pre-tax charges related to its CEO Transition and the Strategic Review recorded during the first quarter of 2026.
Image courtesy Shoe Station Group