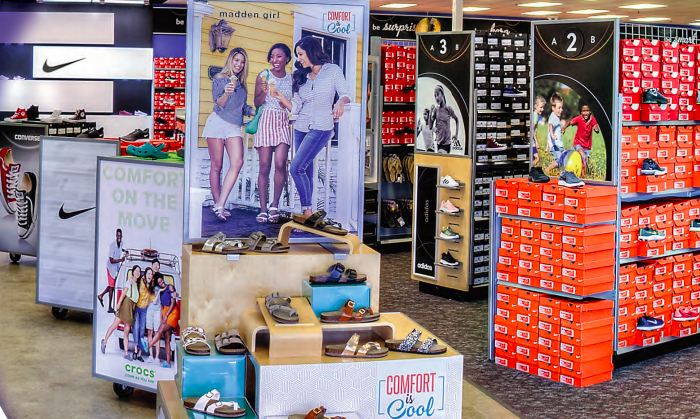
Shares of Shoe Carnival leaped 22.4 percent Wednesday after the footwear retailer reported fourth-quarter results that handily topped Wall Street’s expectations. While boot sales drove the gains, new data-aggregating capabilities are helping enhance merchandising, marketing and real estate decisions.
Shares closed at $37.30, up $6.82, in over-the-counter trading on the day.
In the quarter, earnings dropped 17.6 percent to $1.4 million, or 9 cents a share, from adjusted earnings of $1.7 million, or 11 cents, due to an extra week in the year-ago period. But EPS came in well ahead of Wall Street’s average estimate of 6 cents.
Shoe Carnival showed a net loss of $3.9 million, or 24 cents, in the year-ago quarter after non-cash impairment charges to close stores, additional stock-based compensation as well as income tax expense associated with the enactment of the Tax Act, and again on insurance proceeds from hurricane damage.
Revenues in the latest quarter declined 3.5 percent to $234.7 million due to the latest quarter lasting 13 weeks versus a 14-week year-ago quarter.
Comps grew 4.7 percent, topping expectations of 3.8 percent. By month, comps were up high-single digits in November and low-single in December and January, Shoe Carnival officials said on a conference call with analysts. Traffic in the quarter declined low single digits. Average transaction was flat while conversion and units per transaction increased low-single digits.
Men’s Non-Athletic Paces Category Gains
By category in the fourth quarter, women’s non-athletic grew mid-single digits on a comparable basis. As expected, women’s boots were the key driver. Strong demand for boots produced 90 basis point improvement in merchandise margin for the women’s non-athletic category while driving year-end per-door inventories down double digits versus last year.
Men’s non-athletic category sales rose high-single digits on a comp basis. Men’s seasonal boots posted a low-double-digit comp increase and helped drive a 160 basis point improvement in merchandise margin for the category.
Children shoes were up mid-single-digit on a comparable basis. Children’s athletic increased mid-single-digit, while non-athletic was up high single-digits. Children’s boots increased double-digits on a comp basis, while margin for the category increased 170 basis points.
Adult athletic was up low-single-digits on a comp basis. Said Cliff Sifford, president and CEO, on the call, “While the basketball category remains soft, we continue to be happy with the performance of the casual and running categories.”
Asked about athletic’s underperformance versus other categories in the Q&A session, Sifford said the company was “very pleased” with the category performance in the quarter and is “still positive” about athletic for the current year. Plans call for athletic’s comps to climb low-single digits, in line with overall guidance. Low-single digits to anything under 3.5 percent.
Gross Margins Improve 90 Basis Points
Gross margins increased 90 basis points to 28.4 percent compared to adjusted gross margin of 27.5 percent last year. The merchandise margin increased by 0.5 percent, primarily driven by non-athletic categories. Buying, distribution and occupancy expenses decreased 0.4 percent as a percent of sales.
The reported gross margin of 28.4 percent in the year-ago period included a $3.3 million gain on insurance proceeds related to hurricane-affected stores.
SG&A expenses increased $446,000 in the latest quarter to $65.2 million compared to adjusted SG&A expenses of $64.7 million in the fourth quarter last year. An increase in incentive and equity compensation of $3 million in Q4 was partially offset by the reduction in expenses from having one less week in Q4 this year. As a percent of sales, SG&A expenses increased to 27.8 percent from 26.6 percent in the year-ago fourth quarter.
The reported SG&A expense rate in the year-ago quarter was 28.4 percent and included non-cash impairment charges of $3.4 million for 30 under-performing stores and a $1.9 million increase in stock-based compensation expense tied to tax reform.
For 2018, sales inched up 0.8 percent to $1.03 billion. Comps expanded 4.3 percent. Net income essentially doubled to $38.1 million, or $2.45 per share, from $18.9 million, or $1.15, a year ago. Earnings improved 55.5 percent against adjusted earnings of $24.5 million, or $1.49, in the year-ago period.
The retailer had lifted its guidance on January 14 but sales and earnings topped the revised expectations calling for sales of $1.028 billion, a comp gain of approximately 4 percent, and adjusted EPS in the range of $2.41 to $2.43.
CRM Implementation Starting To Pay Dividends
Listing accomplishments for 2018, Sifford noted that the retailer started the implementation of a new CRM (customer relationship management) tool with a goal of better-reaching customers on a one-to-one basis.
Said Sifford, “We are gaining tremendous insights to our customer’s overall shopping journeys of where, when and how they shop our stores either online or brick and mortar. In addition, we are gaining a better understanding of the brands and categories by store location that our customers count on from Shoe Carnival.”
For 2019, Shoe Carnival plans to utilize the data to better merchandise each individual store market to specific customers and find new store opportunities. Sifford said, “As we move this project forward, we will leverage customer insights to better serve our customers and further differentiate the Shoe Carnival brand down to the individual store level. The opportunity for growth is great, as we segment our holiday customers through the data we have and then target a broader market of customers who have the same characteristics.”
In marketing, a big success was the July relaunch of the Shoe Perks loyalty program. A new Gold level of rewards was added for the chain’s most active customers. On average, Gold members shop 20 percent more than non-gold members each time they shop. The relaunch helped August’s comps increase 6.5 percent on top of the 7 percent comp increase the previous August and helped support a 4.6 percent overall comp in the second half of the year.
Also on the marketing front, Mark Worden, formerly at SC Johnson, was hired as EVP, chief marketing and strategy officer, and McCann Detroit was hired to position Shoe Carnival as “the most distinctive and compelling brand” in the family footwear space. Sifford noted that McCann Detroit has worked with General Motors, Chipotle and Pure Michigan on successful campaigns. Said Sifford, “We believe by combining the expertise of McCann with our unique and entertaining store environment, and our customer centric capabilities, Shoe Carnival continue to grow our comparable store sales and once again expand store count.”
Expansion Ramp Up Set For 2020
On expansion, three stores were opened last year and 14 closed as Shoe Carnival’s real estate and merchandise teams have focused over the last two years on improving the metrics of underperformers or closing them. Initially, Shoe Carnival had intended to close between 30 to 35 stores last year but the performance of several stores improved. Shoe Carnival ended the year with 397 locations.
For 2019, between 7 to 10 stores are expected to close and no new stores are planned. Sifford added, “However, with the great success we have had so far with the implementation of our CRM program, we have identified marketplaces where our core customer lives and we will be searching those markets for new store opportunities. That those opportunities present themselves for 2019 opening, we will react.”
For 2020, the goal is to open 10 new stores.
Said Sifford overall, “I am pleased with all of the decisive strategic actions our teams have taken to further differentiate Shoe Carnival for future growth. The investments we’ve made in technology and customer engagements are incredibly important as we take Shoe Carnival to the next level of growth with today’s consumer.”
For the current year, sales are expected to be in the range of $1.035 billion to $1.043 billion, with a comp increase of low-single digits. EPS is expected to range between $2.60 to $2.70, up from $2.45 in 2018.
Image courtesy Shoe Carnival


