Shoe Carnival Inc. on Wednesday reported comparable store sales for the second quarter increased 1.4 percent while earnings per diluted share increased 5.3 percent to 80 cents, beating Wall Street’s estimates by 2 cents.
However, net sales of $268.2 million marked a 0.1 percent decrease compared to net sales of $268.4 million for the second quarter of fiscal 2018 and also missed analysts’ estimates by $4.5 million.
The shoe retailer’s cash and cash equivalents were $37.5 million with no outstanding debt as of August 3, 2019.
Cliff Sifford, Shoe Carnival’s president and CEO, said, “We are pleased our financial results for the second quarter were in line with our expectations and we believe we remain well positioned to achieve our annual outlook. Shoe Carnival’s robust assortment of family footwear for back-to-school is resonating with new and existing customers resulting in an acceleration of our August sales. Comparable store sales through the first three weeks of August are up 3.5 percent compared to a 6.5 percent increase for the full month of August last year. Our team continues to focus on the execution of our strategic initiatives in the second half of fiscal 2019 as we build upon our strong foundation for sustainable long term growth and shareholder value creation.”
Second Quarter Financial Results
Gross profit margin for the second quarter of fiscal 2019 decreased 0.6 percent to 30.6 percent compared to 31.2 percent in the second quarter of fiscal 2018. Merchandise margin was flat and buying, distribution and occupancy expenses increased 0.6 percent as a percentage of net sales compared to the second quarter of fiscal 2018.
Selling, general and administrative expenses for the second quarter of fiscal 2019 decreased $2.4 million to $66.4 million. As a percentage of net sales, these expenses decreased to 24.8 percent compared to 25.6 percent in the second quarter of fiscal 2018.
Net income for the second quarter of fiscal 2019 was $11.8 million, or $0.80 per diluted share. For the second quarter of fiscal 2018, the company reported net income of $11.8 million, or $0.76 per diluted share.
Six Month Financial Results
Net sales for the first six months of fiscal 2019 decreased $3.8 million to $522.0 million compared to the first six months of fiscal 2018. Comparable store sales increased 0.6 percent for the first six months of fiscal 2019.
Net earnings for the first six months of fiscal 2019 were $25.7 million, or $1.71 per diluted share, compared to net earnings of $24.7 million, or $1.59 per diluted share, in the first six months of fiscal 2018. Included in the first six months of fiscal 2019 was a tax benefit in connection with the vesting of equity-based compensation of approximately $1.9 million, or $0.13 per diluted share. The gross profit margin for the first six months of fiscal 2019 was 30.1 percent compared to 30.6 percent in the same period last year. Selling, general and administrative expenses for the first six months decreased $2.9 million to $126.0 million. As a percentage of net sales, these expenses decreased to 24.1 percent compared to 24.5 percent in the first six months of fiscal 2018.
Store Openings and Closings
The company expects to open one store and close six stores during fiscal 2019 compared to opening three stores and closing 14 stores during fiscal 2018.
Fiscal 2019 Outlook
Based on performance year-to-date, the company is maintaining the high-end of the annual diluted earnings per share guidance of $2.83 and raising the lower-end of the range to $2.77. This compares to diluted earnings per share of $2.45 in the prior fiscal year. With the first half of the year complete, net sales estimates have been refined while maintaining the comparable store sales guidance for the year of a low single-digit increase. Total net sales for the full fiscal year are expected to be in the range of $1.028 billion to $1.033 billion.
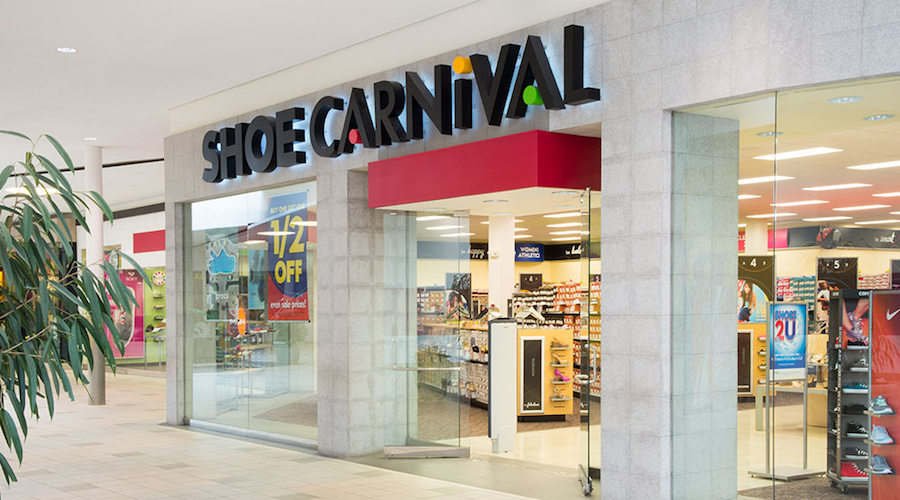
Photo courtesy Shoe Carnival Inc.


