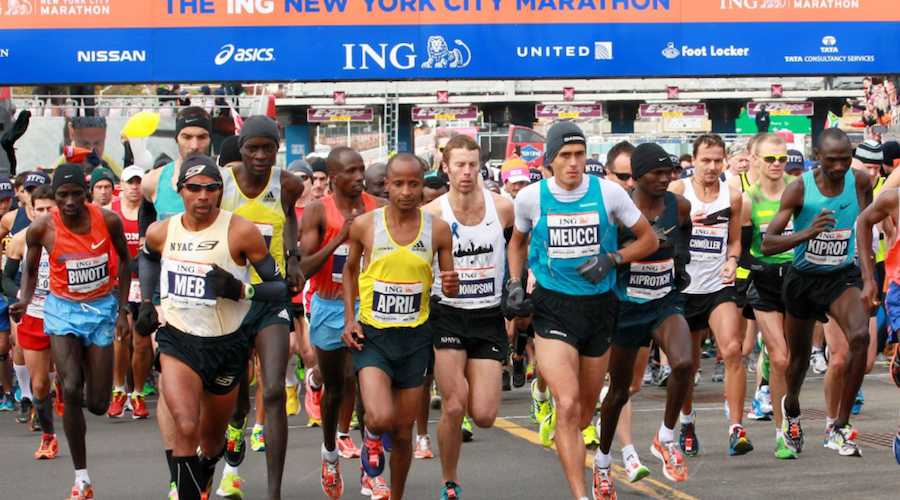
For the third straight year, the number of road race finishers declined in the U.S., as 16.96 million runners crossed a finish line in 2016, a one percent decrease from the 17.1 million finishers in 2015, according to Running USA’s U.S. Road Race Trends report.
Despite the decline, the finisher total leveled off from the nine percent decline seen in 2015, while the 2016 finisher total ranks as the fourth largest in history.
Between 1990 and 2013, finisher totals quickly grew from five million road race runners to over 19 million. Since 2014, the sport has seen a shrinking of sorts, as totals have now dropped under the 17 million finisher mark for the first time since 2012.
As the industry continues to look for ways to keep runners racing and their events growing, the decline is also being seen as a check on unhealthy races, seeing those with unsustainable structures leave the marketplace, allowing sound events to strengthen their foothold.
“While finisher totals continue to fall, however slightly, there are a number of positive signs for the industry,” said Running USA CEO Rich Harshbarger. “As race directors react to declining participation numbers, what we’re seeing is more of them increase value and create better experiences for their runners, partners, charities and communities.”
The number of organized races increased by 100 to 30,400 in 2016, but the number of races with 25,000 or more finishers decreased from 13 total in 2015 to ten in 2016, according to the Running USA Largest Races database. In addition, the 5K distance saw an increase in finishers in 2016, with 8.24 million runners crossing the finish line. However, the 10K, half marathon and “other” distances saw decreases of four percent or greater. The marathon finisher total remained flat.
2016 U.S. Running Snapshot:
- Females account for 9.7 million finishers nationwide and continue to represent 57 percent from event fields. Males in 2016 represented 7.3 million finishers in U.S. races. Overall, there were 16.96 million finishers in U.S. running events, down 1 percent from 2015.
- Total number of U.S. running events reached 30,400, a slight increase from 30,300 in 2015, with the largest growth seen in the half-marathon distance (4 percent).
- The 25 to 44 year old age group continues to be the sweet spot for running, accounting for 49 percent of finishers.
- In 2016, the 5K maintained the #1 position of all race distances with 8.2 million finishers, claiming 49 percent of all finishers in the U.S., while the half-marathon again held the #2 position with approximately 11 percent of the finishers, followed by the 10K (7 percent).
2o16 U.S. Road Race Trends – By The Numbers
U.S. Finishers: Total
U.S. running event finishers in 2016 remained flat compared to 2015. In 2016, there were a total of nearly 17,000,000 (16,957,100), down slightly from 17,114,800 in 2015. This represents a decline of 1 percent. Females account for nearly 9.7 million finishers nationwide and continue to represent 57 percent from event fields. Males in 2016 represented over 7 million finishers in U.S. races.
 U.S. Events: Distance
The total number of events remained flat overall. In 2016, there were a total of 30,400 events, on par with 30,300 in 2015. There were more 5K and half marathon events though and fewer events that are other distances.
| Distance |
2016 Totals: Events |
% of Total |
’14 to ’15 Change |
| 5K |
17,000 |
56% |
3% |
| 10K |
4,200 |
14% |
0% |
| Half Marathon |
2,800 |
9% |
4% |
| 8K/5 Mile |
1,200 |
4% |
0% |
| Marathon |
1,100 |
4% |
0% |
| Other Distances |
4,100 |
13% |
-12% |
| Total |
30,400 |
0% |
Source: Running USA powered by Athlinks
Photo courtesy Running USA


