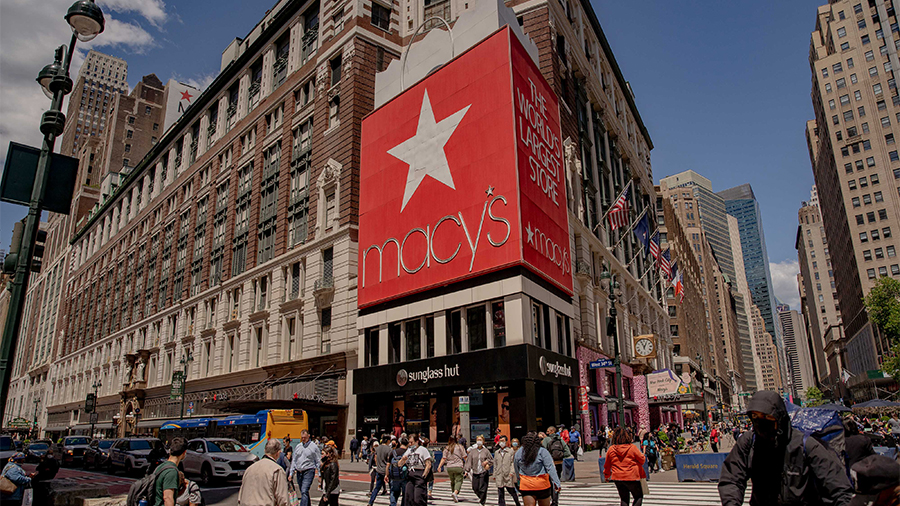
Macy’s, Inc. reported earnings and sales beat Q2 analyst views but reduced its outlook, citing weaker discretionary spending and the need to take markdowns to clear elevated inventories.
Macy’s earnings per share on an adjusted basis fell 22 percent to $1.00, surpassing Wall Street’s consensus estimate of 86 cents. Sales were about flat at $5.6 billion against $5.65 billion, topping Wall Street’s consensus estimate of $5.49 billion.
“During the second quarter, we delivered solid results, despite the challenging environment,” said Jeff Gennette, chairman and chief executive officer of Macy’s, Inc. “Our teams have consistently responded to the dynamic landscape with disciplined, data-driven actions to ensure the health and stability of our business. We believe that we are well positioned to respond to changing consumer behaviors. Despite inflationary pressures, consumers continued to shop at Macy’s as a style source and leading gifting destination. Additionally, Bloomingdale’s and Bluemercury captured demand for luxury brands, resulting in both nameplates outperforming in the quarter.”
“Over the past two years, our Polaris strategy has made us faster and more agile, which has been essential to navigate rapidly changing consumer trends and macro conditions. We expect to come out of this uncertain period in a strong position with a healthy balance sheet, new capabilities and a talented team ready to capture renewed demand,” Gennette continued.
Second Quarter Highlights
(comparisons are to second quarter 2021 unless noted otherwise. Comparisons to 2019 are provided, where appropriate, to benchmark performance given the impact of the pandemic.)
- Diluted earnings per share of $0.99 and Adjusted diluted earnings per share of $1.00. This compares to diluted earnings per share of $1.08 and Adjusted diluted earnings per share of $1.29 in the second quarter of 2021. This compares to diluted earnings per share and Adjusted diluted earnings per share of $0.28 in the second quarter of 2019.
- Comparable sales were down 1.5 percent on an owned basis and down 1.6 percent on an owned-plus-licensed basis, up 4.3 percent and 4.4 percent, respectively, versus the second quarter of 2019.
- Digital sales decreased 5 percent year-over-year while increasing 37 percent versus the second quarter of 2019. Digital penetration was 30 percent of net sales, a 2-percentage point decline from the second quarter of 2021, but 8 percentage points higher than the second quarter of 2019.
Highlights of the company’s nameplates include:
- Macy’s comparable sales were down 2.9 percent on an owned basis and down 2.8 percent, on an owned-plus-licensed basis.
- 43.9 million active customers shopped the Macy’s brand, on a trailing twelve-month basis, a 7 percent increase compared to the prior year.
- Star Rewards program members made up approximately 70 percent of the total Macy’s brand-owned plus licensed sales on a trailing twelve-month basis, up approximately 5 percentage points versus the prior year.
- The company continued to see strength in occasion-based categories, including career and tailored sportswear, fragrances, shoes, dresses, and luggage.
- Bloomingdale’s comparable sales on an owned basis were up 8.8 percent and on an owned-plus-licensed basis were up 5.8 percent. 4.0 million active customers shopped the Bloomingdale’s brand, on a trailing twelve-month basis, a 14 percent increase over the prior year. Results were driven by strength across women’s, men’s and kid’s contemporary and dressy apparel as well as luggage.
- Bluemercury comparable sales were up 7.6 percent on an owned and owned-plus-licensed basis. Approximately 700,000 active customers shopped the Bluemercury brand, on a trailing twelve-month basis, a 9 percent increase over the prior year.
-
-
Inventory turnover, on a trailing twelve-month basis, was relatively flat in 2021 and improved 15 percent over 2019.
- Inventory was up 7 percent year-over-year and down 8 percent versus 2019, reflecting disciplined inventory management in an environment of continued supply chain volatility. Where it had flexibility, the company cut receipts to manage inventory levels in line with consumer demand. However, in certain categories inventory levels remain elevated due to reduced year-over-year sell-throughs since Father’s Day driven by the industry-wide levels of excess inventory and a slowdown in consumer discretionary spend.
- The company is targeting appropriate inventory levels by the end of the year and will continue to flow fresh product in those categories in which customers are signaling demand. Simultaneously, the company is taking the required markdowns to clear aged inventory, in seasonal goods, private brand merchandise and pandemic-related categories, such as active, casual sportswear, sleepwear, and soft home.
Gross margin for the quarter was 38.9 percent, down from 40.6 percent in the second quarter of 2021
- Merchandise margin degradation was driven by a year-over-year increase in permanent markdowns within the Macy’s brand, largely driven by pandemic-related categories, seasonal goods and private brand merchandise.
- Delivery expense as a percent of net sales increased 10 basis points, driven largely by higher fuel costs.
-
SG&A expense of $1.98 billion, an $83 million increase
- SG&A expense as a percent of sales was 35.4 percent, a deterioration of 180 basis points compared to the second quarter of 2021 and an improvement of 390 basis points compared to the second quarter of 2019. The improvement versus 2019 is a result of the cost savings achieved through the 2020 Polaris restructurings.
- The prior year’s quarter benefited from a significant number of open positions due to the tight labor market. The positions have since largely been filled.
- As of May 1, 2022, all store and distribution colleagues are now at a minimum wage base of $15 or above. The company is adjusting colleague compensation to remain a competitive and attractive employer of choice, while simultaneously remaining disciplined in its SG&A productivity efforts.
Net credit card revenue of $204 million, up $7 million
- Represented 3.6 percent of sales, 10 basis points higher than the prior year period.
- Performance driven by better-than-expected bad debt levels, larger balances within the portfolio as well as higher than expected spend on co-brand credit cards.
2022 Guidance
The company’s lower outlook for the remainder of the year incorporates the risk it sees in the continued deterioration of consumer discretionary spending in some of its categories and the level of inventory within the industry, as well as risks associated with a more pronounced macro downturn. This outlook reflects a careful view of the impacts of the pressures faced by the consumer and those placed on the business given the weakening macro environment. Additionally, the company’s outlook incorporates the markdowns and promotions it anticipates needing to liquidate aged inventory and further reduce the merchandise category stock to sales imbalances by the end of the year.
The updated guidance calls for:
- Sales in the range of $24,340 million to $24,580 million, down from guidance in the range of $24,460 million to $24,700 million previously;
- Adjusted EBITDA as a percent of sales to be approximately 10.5 percent, down from 11.2 percent to 11.7 percent previously; and
- Adjusted diluted earnings per share in the range of $4.00 to $4.20, down from $4.53 to $4.95 previously.


