![]() Intrawest Resorts Holdings, Inc. reported skier visits increased 7.9 percent and retail and rental revenue 4.5 percent for the 2013-14 ski season ended April 30.
Intrawest Resorts Holdings, Inc. reported skier visits increased 7.9 percent and retail and rental revenue 4.5 percent for the 2013-14 ski season ended April 30.
FY14 Ski Season Growth Data (Nov – Apr 30) (1)(2) | ||||
| Metric | % | |||
| Skier Visits | 7.9% | |||
| Lift Revenue | 5.7% | |||
| Lodging Revenue | 2.9% | |||
| Ski School Revenue | 8.1% | |||
| Retail and Rental Revenue | 4.5% | |||
| Food and Beverage Revenue | 8.2% | |||
| Other Revenue | 1.9% | |||
| (1) Revenue growth data is presented in constant currency. | ||||
| (2) This data is preliminary and subject to normal period end review and adjustments. | ||||
 The Denver, CO-based company released the figures Tuesday along with its financial results for the third fiscal quarter ended March 31. During the quarter, Skier Visits to its seven mountain resorts increased 5.5 percent to 2.25 million, while Retail and Rental revenues increased 1.4 percent to $25.0 million. Ski School and Food and Beverage sales, meanwhile, increased 6.2 and 6.1 percent respectively.
 “We are very pleased with the results of our third fiscal quarter,” said CEO Bill Jensen. “Not only did we complete our initial public offering and enhance our capital structure, positioning Intrawest for growth, we also delivered solid quarterly results.”
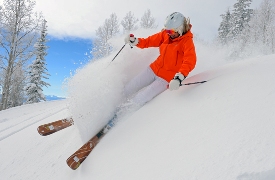
| A skier shreds the slopes at Steamboat in February. Photo by Larry Pierce. |
Intrawest operates seven four-season mountain resorts with more than 11,000 skiable acres and more than 1,150 acres of land available for real estate development. Those resorts include Steamboat Ski & Resort and Winter Park Resort in Colorado, Mont Tremblant Resort in Quebec, Stratton Mountain Resort in Vermont, Snowshoe Mountain Resort in West Virginia and half of Blue Mountain Ski Resort in Pennsylvania. Its Adventure Segment operates an adventure travel business, the cornerstone of which is Canadian Mountain Holidays, the leading heli-skiing adventure company in North America.
Fiscal 2014 outlook
Intrawest said for full fiscal year 2014, it expects total reportable segment revenue to be in the range of $497 million to $507 million, or a decrease of between 4 percent and 2 percent, compared to fiscal 2013. In constant currency, the company expects total reportable segment revenue to be in the range of $512 million to $522 million, or between a decrease of 1 percent and an increase of 1 percent, compared to total reportable segment revenue for fiscal 2013.
Total segment Adjusted EBITDA is expected to be in the range of $98 million to $100 million, or a decrease of between 7 percent and 5 percent, compared to segment Adjusted EBITDA for fiscal 2013. In constant currency, the company expects total segment Adjusted EBITDA to be in the range of $103 million to $105 million, or a decrease of between 3 percent and 0 percent, compared to segment Adjusted EBITDA for fiscal 2013.
Major factors impacting the company’s outlook for full year fiscal 2014 compared to the prior year results include: the acceleration of sales commissions received on the exit of a brokerage engagement at Honua Kai Resort and Spa in fiscal 2013, reduced fire suppression activities in fiscal 2014 and the additional costs associated with being a public company.
Segment Results:
Mountain
| Three Months Ended | Nine Months Ended | ||||||||||||||||||||||||||||
| March 31, | March 31, | ||||||||||||||||||||||||||||
| 2013 | 2014 | Change | % Change | 2013 | 2014 | Change | % Change | ||||||||||||||||||||||
| Skier Visits | 2,326,322 | 2,453,626 | 127,304 | 5.5% | 2,986,765 | 3,195,913 | 209,148 | 7.0% | |||||||||||||||||||||
| Revenue per Visit | $ | 89.27 | $ | 87.81 | $ | (1.46) | -1.6% | $ | 104.79 | $ | 101.61 | $ | (3.18) | -3.0% | |||||||||||||||
| ETP | $ | 45.66 | $ | 44.95 | $ | (0.71) | -1.6% | $ | 46.17 | $ | 44.83 | $ | (1.34) | -2.9% | |||||||||||||||
| RevPAR | $ | 111.19 | $ | 113.25 | $ | 2.06 | 1.9% | $ | 64.85 | $ | 64.83 | $ | (0.02) | 0.0% | |||||||||||||||
| ADR | $ | 177.88 | $ | 175.07 | $ | (2.81) | -1.6% | $ | 163.31 | $ | 161.61 | $ | (1.70) | -1.0% | |||||||||||||||
| Mountain revenue: | (dollars in thousands) | (dollars in thousands) | |||||||||||||||||||||||||||
| Lift | $ | 106,213 | $ | 110,291 | $ | 4,078 | 3.8% | $ | 137,912 | $ | 143,264 | $ | 5,352 | 3.9% | |||||||||||||||
| Lodging | 19,447 | 19,210 | (237) | -1.2% | 37,071 | 36,797 | (274) | -0.7% | |||||||||||||||||||||
| Ski School | 19,613 | 20,825 | 1,212 | 6.2% | 26,031 | 27,950 | 1,919 | 7.4% | |||||||||||||||||||||
| Retail and Rental | 24,702 | 25,038 | 336 | 1.4% | 41,476 | 41,944 | 468 | 1.1% | |||||||||||||||||||||
| Food and Beverage | 25,878 | 27,469 | 1,591 | 6.1% | 40,273 | 42,490 | 2,217 | 5.5% | |||||||||||||||||||||
| Other | 11,821 | 12,619 | 798 | 6.8% | 30,208 | 32,303 | 2,095 | 6.9% | |||||||||||||||||||||
| Total Mountain revenue | $ | 207,674 | $ | 215,452 | $ | 7,778 | 3.7% | $ | 312,971 | $ | 324,748 | $ | 11,777 | 3.8% | |||||||||||||||
| Mountain Adjusted EBITDA | |||||||||||||||||||||||||||||


