The Forzani Group Ltd. reported total revenue was up 10.2% in the fourth quarter ended Jan. 30 to $410.9 million with same-store sales ahead 7.3%. Net earnings grew 5.6% to $24.2 million, or 87 cents a share. Excluding licensed product sales that were hurt by last year's Winter Olympics in Vancouver, comparative store sales were up 5.1% across all categories in the first eight weeks of the current year.
“Our fourth quarter and annual results attest to the strength of our strategic plan and its execution over the past year,” said Bob Sartor, FGL's chief executive officer. “Despite significant increases in one-time and structural costs, we outperformed both our Canadian retail peer group and the North American sporting goods peer group in the key same-store sales metric, and delivered a 28% increase in EPS this past year.”
“Looking to fiscal 2012, results from the start of the first quarter although strong in many categories, do not offset the previous year's strength in licensed apparel categories,which were boosted by the 2010 Vancouver Olympics last year. Excluding licensed apparel, comparative store sales were in line with expectations despite poor spring weather.”
Financial Summary

----------------------------------------------------------------------------
                                    For the thirteen     For the fifty-two
                                         weeks ended           weeks ended
----------------------------------------------------------------------------
                                   Jan. 30,  Jan. 31,   Jan. 30,   Jan. 31,
                                      2011      2010       2011       2010
----------------------------------------------------------------------------
Revenue ($000s)
 Retail                            343,457   317,813  1,060,541    990,706
 Wholesale                          67,471    55,110    388,178    367,540
                               ---------------------------------------------
 Total                             410,928   372,923  1,448,719  1,358,246
----------------------------------------------------------------------------
EBITA Margin                          12.2%     12.8%       7.6%       7.1%
----------------------------------------------------------------------------
Net Earnings ($000s)                24,215    22,923     35,418     28,778
----------------------------------------------------------------------------
Earnings Per Share (Diluted)      $   0.84  $   0.75   $   1.20  $    0.94
----------------------------------------------------------------------------

Same-Store Sales
 Corporate                             9.5%     (4.1%)      7.5%      (1.1%)
 Franchise                             3.7%     (1.5%)      2.2%       0.0%
----------------------------------------------------------------------------
Consolidated                           7.3%     (3.1%)      5.5%      (0.7%)
----------------------------------------------------------------------------
Progress Against Strategic Plan
FGL executives said the company had made progress during the year against its strategic plan to unify and simplify its business, expand its reach, and improve productivity. Specifically, and among other things:
- During the year, FGL completed the planned consolidation of its two outdoor and lifestyle banners, Coast Mountain Sports and Atmosphere, and opened its first corporately-owned Atmosphere prototype store, in Red Deer, Alberta.
- During the year, as a test, FGL opened 11 GNC performance nutrition concept shops within FGL stores in the Edmonton market as a follow up to the prior year's test in the Calgary market.
- During the year, FGL added an additional 41 Nevada Bob's Golf concept shops to Sport Chek stores, and continued to close less profitable stand-alone Nevada Bob's stores. Plans for fiscal 2012 are to add an additional 19 concept shops to existing Sport Chek locations.
- Based on the success of the Nevada Bob's Golf concept shops, FGL opened 27 Hockey Experts concept shops within key Sport Chek stores. These shops expand the product offering to meet the needs of “elite” level players. Plans for fiscal 2012 are to add an additional 20 concept shops to existing Sport Chek locations.
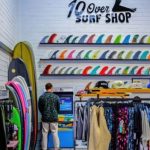
- Late in the year, FGL opened its first S3 concept shop within Sport Chek. As the name suggests, the S3 concept is targeting “Surf, Skate, Snow” footwear and clothing categories by adding authentic surf and skate brands to Sport Chek's category-killer selection of snowboard brands. Plans for fiscal 2012 are to add a further 22 concept shops to existing Sport Chek locations.
- FGL completed its first full year of business in its e-commerce initiative, Sportchek.ca. FGL is now able to reach customers outside its normal trading area and provide support to the estimated 70% of Canadian consumers that research their purchases online. The state of the art site contains a catalogue with more than 10,000 unique product styles and colours. The site is supported by world class e-commerce provider GSI Commerce Solutions Inc. In the coming year, FGL plans to further improve the site's consumer experience while expanding its product selection.
- Subsequent to year end, FGL completed the acquisition of Toronto-based Sports International CSTS Inc. (“Sportsphere”), a manufacturer and distributor of team and corporate logo'd apparel. In keeping with its stated intention to extend its consumer reach, FGL plans to integrate Sportsphere into its wholesale operations and grow its sales/marketing channels across Canada.
Fiscal Fourth Quarter Financial Results
FGL's fiscal 2011 fourth quarter same-store sales increase of 7.3% was the result of continued execution of the Company's strategic initiatives in key hard-good categories, the impact that seasonably cold weather had on sales of winter categories early in the quarter and improved consumer confidence throughout the Christmas and Boxing Day period. FGL's annualized same-store sales performance of 5.5% exceeded both the Canadian retail peer group at 0.8% and the North American sporting goods peer group at 4.7%.
FGL's total revenue was up 10.2% from a year earlier and included an 8.1% increase in retail sales and a 22.4% increase in wholesale sales to third parties and the franchise network. The wholesale sales increase was driven by early shipment of key spring product lines by the INA International division.
Retail system sales, which include sales from corporate and franchise stores, were $532.3 million, an increase of $32.4 million, or 6.5%, from the comparable 13-week sales of $499.9 million a year earlier.
Gross profit was $163.2 million, up 6.9% from $152.6 million a year earlier, and gross margin was 39.7% of revenue compared with 40.9% of revenue a year earlier. The reduced gross margin rate was primarily due to pricing strategy in the corporate division and a shift in the revenue mix toward lower margined wholesale from higher margined corporate revenues, which offset margin rate gains in the wholesale business.
Store operating expenses were flat in absolute dollars for the fiscal 2011 fourth quarter from a year earlier. As a percentage of retail revenues, store operating expenses fell to 22.3% from 24.1% in the prior year, reflecting the impact of the strong sales results on variable costs. Same-store operating expenses were 18.7% of corporate store revenue compared to 21.9% in the prior year. Same-store expenses, in absolute dollars, decreased $4.0 million or 6.1% as a result of tightly controlled store wages which more than offset increased accruals for year end performance-based compensation driven by the increase in sales.
General and administrative expenses were 8.9% of revenues compared with 7.6% a year earlier. In absolute dollars, general and administrative costs were up $8.2 million primarily as a result of the following:
– $2.8 million increase in accruals for performance-based compensation costs resulting from the Company's 27% increase in annual EPS from the prior year;
– $4.0 million increase in stock-based compensation costs resulting from the 28% increase in the value of the Company's shares in the quarter;
– $1.3 million in non-capitalizable information technology project costs; and
– $0.5 million increase in net advertising expenditures, made to drive foot traffic in the key selling period.
EBITA was $50.0 million or 12.2% of revenues, up $2.3 million and 4.9% respectively from the prior year's fourth quarter, as incremental sales and margins more than offset the increased general and administrative expenses.
Earnings before income taxes were $36.6 million, up 12.3% when compared with pre-tax earnings of $32.6 million a year earlier.
Net earnings for the quarter were $24.2 million or $0.84 per share, compared with $22.9 million or $0.75 per share earned in the prior year. The current quarter's earnings were negatively impacted by a higher tax rate resulting from Federal Budget changes related to taxation of stock-based compensation costs. This change reduced net earnings by $1.5 million in the quarter or $0.05 per share.
Cash flow from operations(2) increased to $45.6 million, or $1.59 per share, from $38.0 million, or $1.24 per share, in the prior year.
Fourth Quarter Store Activity
At the end of the fourth quarter, the Company had 534 stores, 24 less than a year earlier. However, the Company had only 0.4% less retail selling space (a reduction of 23,520 square feet) compared with a year earlier, due to FGL's strategy of increasing average store size while closing smaller, less profitable locations. Corporate stores totalled 321 at the end of the fourth quarter, down 21 from a year earlier, while franchise stores totalled 213, down three from a year earlier.
During the quarter, the Company decreased the net number of corporate stores by nine with the closing of six Sport Mart stores, two Nevada Bob's Golf stores, one Fitness Source store, one Athletes World store and one Sport Chek store. Offsetting the eleven closures listed above, FGL opened two additional Sport Chek locations and converted one Nevada Bob's Golf store to a Fitness Source store.
In the franchise division, the store count remained static during the quarter, as FGL franchisees opened two Atmosphere stores while amalgamating one Fitness Source and one Nevada Bob's Golf stores into an adjacent Sports Experts store.
Fiscal 2011 Annual Financial Results
The main drivers affecting financial results for the year consisted of: our strategic initiative roll-out and tactical marketing execution in support of one-time sports related events such as the Vancouver 2010 Winter Olympics and FIFA World Cup, favourable weather throughout much of the year, and improved “post-recession” consumer confidence. Disciplined expense controls helped to offset significant one-time and performance related costs incurred during the year.
Certain key financial metrics for the fiscal year are provided in the financial summary table. Following are additional important metrics compared with a year earlier:
– Retail system sales-$1.635 billion, up 4.9% from $1.558 billion;
– Gross profit-$518.9 million, up 8.6% from $478.0 million;
– Gross margin-35.8% of revenue, compared with 35.2% of revenue;
– Store operating expenses-27.6% of corporate revenue compared with 28.8% of corporate revenue. Same-store operating expenses were 24.3% versus 26.2% in the prior year. On an absolute dollar basis, comparable store operating expenses were down $0.4 million from the prior year;
– General and administrative expenses-8.0% of total revenue up from 7.1%. Overall, general and administrative expenses increased $20.2 million in absolute dollars due primarily to significant increases in four key areas:
— $7.9 million in performance-based compensation resulting from the 28% increase in EPS from the prior year;
— $5.5 million in stock-based compensation costs resulting from the 31% increase in the Company's share price over the year;
— $3.8 million in non-capitalizable information technology project costs; and
— $1.3 million in additional net marketing expenditures made to support various events and initiatives throughout the year, including the Atmosphere re-bannering, Vancouver Olympics, FIFA World Cup and the Nike Livestrong product launch.
– EBITA-$109.7 million, versus $97.1 million in the prior year;
– Earnings-$35.4 million or $1.20 per share (diluted) compared with $28.8 million or $0.94 per share (diluted). As noted above, earnings for the year were negatively impacted by a higher tax rate resulting from Federal Budget changes related to taxation of stock-based compensation costs. This change reduced net earnings by $1.5 million or $0.05 per share;
– Cash flow from operations-$92.9 million or $3.16 per share, a 19.4% increase when compared with $77.8 million or $2.55 per share in the prior year; and
– Return on equity – 10.1%, up 171 basis points compared to 8.39% in the prior year.
Balance Sheet
The Company's working capital was $97.9 million, down $3.1 million or 3.1% from the prior year. This reduction was primarily the result of the Company's repurchase of $35.7 million of its shares under the Normal Course Issuer Bid during the year.
Dividends
On April 5, 2011, the Company declared a dividend of $0.075 per Class “A” share, payable on May 2, 2011 to shareholders of record on April 18, 2011. All dividends paid by the Company are, pursuant to subsection 89 (14) of the Income Tax Act, designated as eligible dividends. An eligible dividend paid to a Canadian resident is entitled to the enhanced dividend tax credit.
Preliminary Q1 Results
As expected, results in the first eight weeks of the fiscal 2012 were down slightly when compared to the prior year's first quarter results. The first four weeks sales were up against sales of Vancouver 2010 Winter Olympic licensed products, which offset positive same store results in all other categories to post a decline of 3.3%. Excluding licensed product sales, comparative store sales were up 5.1% across all categories. In the subsequent four weeks, continuing winter weather hampered sales of spring hard-good categories to post an overall 2.8% comparative store decline.
Overall retail system same store sales decreased by 2.1% for the first eight weeks (against the prior year's increase of 14.5%). Of the total decline, same-store sales in the period decreased by 3.0% for corporate locations (against the prior year's increase of 15.5%), and decreased by 0.2% for franchise stores, (against the prior year's increase of 12.7%).
Additional Quarterly Disclosure
In conjunction with this release, the Company invites you to listen to its teleconference call on Tuesday, April 5th, 2011 at 4:30 p.m. Eastern Standard Time. The conference call will also be available simultaneously and in its entirety, including presentation materials, to all interested investors and the news media through a web cast which can be accessed on the Company's website at www.forzanigroup.com. Please visit the website at least 15 minutes prior to the indicated start time to download and install any necessary software. The presentation materials are also currently available on our website at www.forzanigroup.com.
The Forzani Group Ltd.
Consolidated Statements of Operations
(in thousands, except per share data)

                                                     For the 52 weeks ended
                                                  January 30,    January 31,
                                                        2011           2010
----------------------------------------------------------------------------
----------------------------------------------------------------------------

Revenue
 Retail                                          $ 1,060,541   $    990,706
 Wholesale                                           388,178        367,540
----------------------------------------------------------------------------
                                                   1,448,719      1,358,246
Cost of sales                                        929,808        880,209
----------------------------------------------------------------------------

Gross margin                                         518,911        478,037
----------------------------------------------------------------------------
Operating and administrative expenses
 Store operating                                     292,915        284,895
 General and administrative                          116,268         96,073
----------------------------------------------------------------------------
                                                     409,183        380,968
----------------------------------------------------------------------------

Operating earnings before undernoted items           109,728         97,069
----------------------------------------------------------------------------

Amortization of capital assets                        54,047         53,504
Interest                                               2,843          2,488
----------------------------------------------------------------------------
                                                      56,890         55,992
----------------------------------------------------------------------------

Earnings before income taxes                          52,838         41,077
----------------------------------------------------------------------------

Income tax expense
 Current                                              10,960          8,858
 Future                                                6,460          3,441
----------------------------------------------------------------------------
                                                      17,420         12,299
----------------------------------------------------------------------------

Net earnings for the period                      $    35,418   $     28,778
----------------------------------------------------------------------------
----------------------------------------------------------------------------
Basic earnings per share                         $      1.21   $       0.94
----------------------------------------------------------------------------
----------------------------------------------------------------------------
Diluted earnings per share                       $      1.20   $       0.94
----------------------------------------------------------------------------
----------------------------------------------------------------------------


