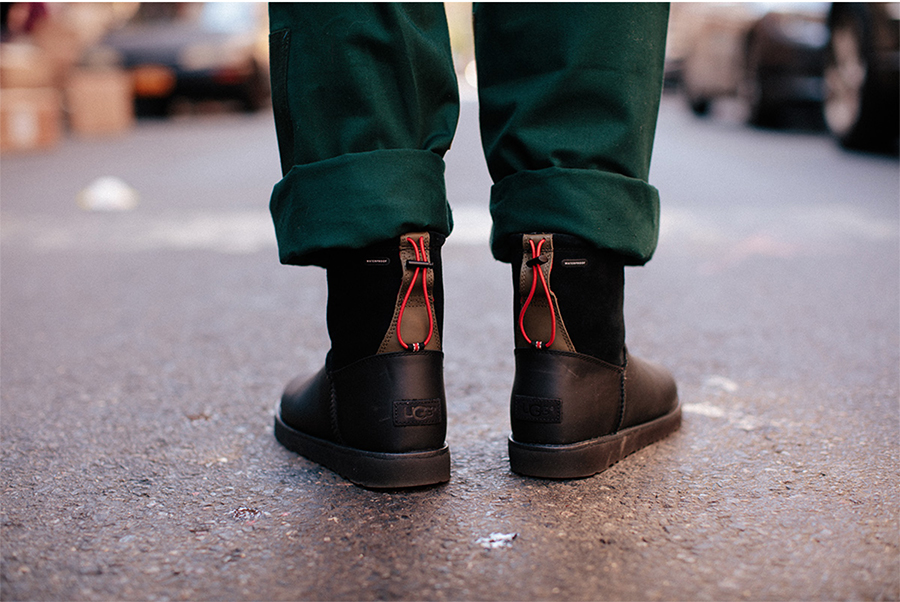
Deckers Brands reported earnings and sales that came in well ahead of guidance in its second quarter ended September 30.
“I am very pleased with the progress we have made, and continue to make, executing on our operating profit improvement plan. Our goal remains to achieve an incremental $100 million of operating profit by the end of our fiscal year 2020, and operating margins of at least 13 percent by focusing on full-priced selling, driving supply chain efficiencies, implementing process improvements, reducing indirect spend, and closing retail stores that do not meet our financial objectives,” said Dave Powers, president and chief executive officer. “This quarter is yet another testament to the power of our transformation, as we generated a 220 basis point increase in gross margin and earnings per share that were ahead of expectations. As we head into the holiday selling season with a stronger product lineup and cleaner channel inventories compared to a year ago, we are confident that Deckers is well positioned to achieve our near- and medium-term financial targets and deliver increased shareholder value.”
“In light of our strong results and our confidence in the back half of the fiscal year, we are increasing our outlook for the year. In addition, I am pleased to announce that the board of directors has authorized a new $335 million share repurchase program. Combined with the $65 million remaining under our current authorization, we now have the ability to repurchase a total of $400 million worth of shares, or approximately 20 percent of our market capitalization. We intend to aggressively repurchase our shares to reward our long-term shareholders with accelerated EPS growth.”
Second Quarter Fiscal 2018 Financial Review
- Net sales declined 0.7 percent to $482.5 million compared to $485.9 million for the same period last year. On a constant currency basis, net sales decreased 0.3 percent.
- Gross margin was 46.7 percent compared to 44.5 percent for the same period last year.
- SG&A expenses were $157.8 million compared to $162.4 million for the same period last year.
- Non-GAAP SG&A expenses were $157.3 million.Operating income was $67.4 million compared to $54 million for the same period last year.
- Non-GAAP operating income was $67.8 million.
- Diluted earnings per share was $1.54 compared to $1.21 for the same period last year.
- Non-GAAP diluted earnings per share was $1.54.
Previously, the company had expected second quarter sales to be down approximately 10 percent versus the same period last year, primarily as a result of store closures, and the earlier than planned shipments in the first quarter. Non-GAAP EPS was expected to come in the range of $1.00 to $1.05 compared to $1.23 for the same period last year.
Brand Summary
- UGG brand net sales for the second quarter declined 2.9 percent to $400.4 million compared to $412.2 million for the same period last year.
- HOKA ONE ONE brand net sales for the second quarter increased 34.4 percent to $40.6 million compared to $30.2 million for the same period last year.
- Teva brand net sales for the second quarter increased 24.9 percent to $21.4 million compared to $17.1 million for the same period last year.
- Sanuk brand net sales for the second quarter decreased 19.3 percent to $15.2 million compared to $18.9 million for the same period last year.
Channel Summary (Included In Brand Sales Numbers Above)
- Wholesale net sales for the second quarter declined 2.2 percent to $391.2 million compared to $399.9 million for the same period last year.
- DTC net sales for the second quarter increased 6.2 percent to $91.3 million compared to $86 million for the same period last year. DTC comparable sales for the second quarter increased 3.7 percent over the same period last year.
Geographic Summary (Included In Brand And Channel Sales Numbers Above)
- Domestic net sales for the second quarter decreased 3.1 percent to $302.7 million compared to $312.2 million for the same period last year.
- International net sales for the second quarter increased 3.5 percent to $179.8 million compared to $173.7 million for the same period last year.
Balance Sheet (September 30, 2017 Compared To September 30, 2016)
- Cash and cash equivalents were $230.6 million compared to $110 million.Deckers had $165.3 million in outstanding borrowings compared to $310.4 million.
- Inventories decreased 3.9 percent to $555.6 million from $578 million.Full Year Fiscal 2018 Outlook for the
Twelve Month Period Ending March 31, 2018
Deckers now expects fiscal year 2018 results to be:
- Net sales are expected to be in the range of up approximately 1 percent to up 2 percent versus last year.
- Gross margin is expected to be approximately 47.5 percent.
- SG&A expenses as a percentage of sales are projected to be approximately 37 percent.
- Non-GAAP diluted earnings per share are expected to be in the range of $4.15 to $4.30.
- This excludes any charges that may occur from additional store closures, restructuring and other charges.
- The earnings per share guidance does not assume any future share repurchase.
Previously, Deckers expected EPS in the range of $3.95 to $4.15 a share. Sale were expected to be in the range of down 2 percent to flat.
Third Quarter Fiscal 2018 Outlook For The Three Month Period Ending December 31, 2017
- The company expects third quarter fiscal 2018 net sales to be in the range of $735 million to $745 million.
- Non-GAAP diluted earnings per share are expected to be in the range of $3.65 to $3.75.
- This excludes any charges that may occur from additional store closures, restructuring and other charges.
- The earnings per share guidance does not assume any future share repurchase.


