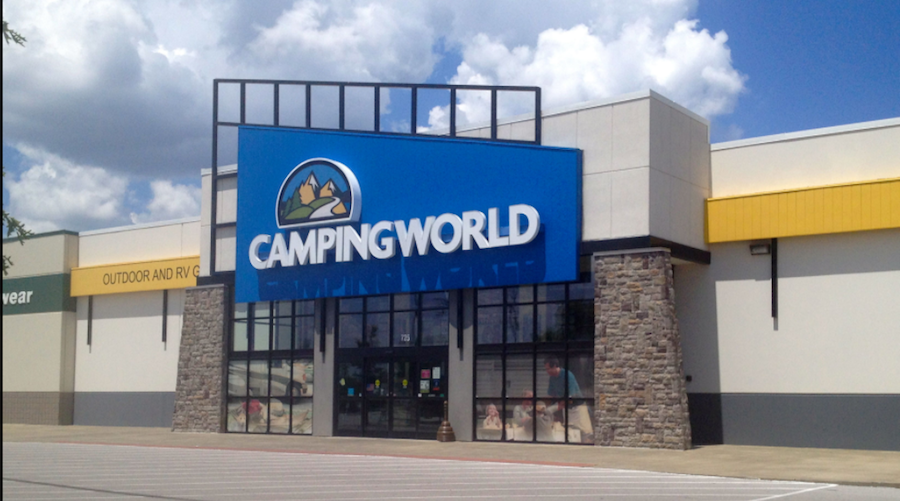
Camping World Holdings, which acquired Gander Mountain earlier this year, reported pro-forma earnings rose 41.6 percent on a 20.1 percent revenue gains.
Second Quarter 2017 Summary
- Total revenue increased 20.1 percent to $1.3 billion;
- Gross profit increased 24.5 percent to $372.8 million and gross margin increased 102 basis points to 29.1 percent;
- Income from operations increased 32.3 percent to $136.8 million and operating margin increased 98 basis points to 10.7 percent;
- Net income increased 26.3 percent to $105.3 million, net income margin increased 40 basis points to 8.2 percent, and adjusted pro forma net income increased 41.6 percent to $77.7 million;
- Diluted earnings per share was $0.84 and adjusted pro forma earnings per fully exchanged and diluted share increased 38.5 percent to $0.91; and
- Adjusted EBITDA increased 36.0 percent to $142.1 million and adjusted EBITDA margin increased 130 basis points to 11.1 percent.
Marcus Lemonis, chairman and chief executive officer, stated, “We delivered exceptional record-breaking results in the second quarter. Revenue increased 20.1 percent to $1.3 billion, net income increased 26.3 percent to $105.3 million, adjusted pro forma EBITDA increased 36.0 percent to $142.1 million and adjusted net income increased 41.6 percent to $77.7 million. We believe these results clearly demonstrate the power and leverage of our unique operating model, which sells a comprehensive portfolio of products and services across a growing database of consumers being driven by our national network of retail locations that cater to RV, boating and outdoor enthusiasts. While our business model has traditionally been focused on the RV owner, we see a much broader opportunity to leverage our products and services across the larger base of outdoor lifestyle consumers.”
Second Quarter 2017 Results Compared to Second Quarter 2016 Results
Units and Average Selling Prices
New vehicle units sold increased 38.2 percent to 21,930 and the average selling price of a new vehicle decreased 4.5 percent to $34,787 in the second quarter of fiscal 2017. The increase in new vehicle units sold was primarily driven by strong consumer demand for new vehicles and a shortage of supply of used vehicles. The decrease in the average selling price of a new vehicle was driven by a higher mix of lower-priced towable units.
Used vehicle units sold decreased 8.4 percent to 9,073 and the average selling price of a used vehicle decreased 0.9 percent to $21,660 in the second quarter of fiscal 2017. The decrease in used vehicle units sold was primarily driven by reduced inventory availability resulting from fewer trades on new vehicle unit sales and the disposition of the automobile unit business as a result of the distribution of the AutoMatch business in the second quarter of 2016.
Revenue
Total revenue increased 20.1 percent to $1.3 billion from $1.1 billion in the second quarter of fiscal 2016.
Consumer Services and Plans revenue increased 5.9 percent to $48.1 million from $45.4 million in the second quarter of fiscal 2016. The increase was primarily driven by increases in vehicle insurance and Good Sam TravelAssist programs primarily due to increased policies in force, roadside assistance contracts and other increases.
Retail revenue increased 20.7 percent to $1.2 billion from $1.0 billion in the second quarter of fiscal 2016. Within the Retail segment, new vehicle revenue increased 31.9 percent to $762.9 million, used vehicle revenue decreased 9.2 percent to $196.5 million, parts, services and other revenue increased 10.4 percent to $174.2 million and finance and insurance revenue increased 44.5 percent to $101.0 million. Continued strong consumer demand for recreational vehicles combined with a shortage of supply of used vehicles benefited new vehicle and finance and insurance sales and decreased used vehicle sales. Finance and insurance net revenue as a percentage of total new and used vehicle revenue increased to 10.5 percent from 8.8 percent in the second quarter of fiscal 2016, and benefited from a sales mix shift toward lower-priced new towable units and better integration of the finance and insurance selling process.
Same store sales of the 115 retail locations that were open both at the beginning of the preceding fiscal year and at the end of the second quarter of fiscal 2017 increased 10.6 percent to $1.1 billion. The increase in same store sales at retail locations was primarily driven by the increased volume of new towable units sold, and, to a lesser extent, revenue increases from finance and insurance, partially offset by a decrease in same store sales from used vehicle units sold.
The company operated a total of 137 retail locations and two Overton’s retail locations as of June 30, 2017, compared to 120 retail locations at June 30, 2016. In the second quarter of fiscal 2017, the company added ten RV-centric locations from completed acquisitions, one RV-centric location from a greenfield opening, and two Overton’s retail locations.
Gross Profit
Gross profit increased 24.5 percent to $372.8 million and gross margin increased 102 basis points to 29.1 percent from the second quarter of fiscal 2016. Consumer Services and Plans gross profit increased 5.2 percent to $27.5 million and gross margin decreased 40 basis points to 57.3 percent of segment revenue from the second quarter of fiscal 2016. The decrease in Consumer Services and Plans gross margin was primarily due to reduced gross margin from consumer magazines, partially offset by an increase from the vehicle insurance and TravelAssist programs. Retail gross profit increased 26.3 percent to $345.3 million and gross margin increased 124 basis points to 28.0 percent of segment revenue from the second quarter of fiscal 2016. The increase in Retail gross margin was driven primarily by a 173 basis point increase in the finance and insurance penetration rate to 10.5 percent of vehicle sales from 8.8 percent of vehicle sales in the second quarter of fiscal 2016, and a 593 basis point increase in gross margin from used vehicle unit sales to 27.0 percent from the second quarter of fiscal 2016.
Operating Expenses
Total operating expenses increased 20.4 percent to $236.1 million from the second quarter of fiscal 2016. Selling, general and administrative (SG&A) expenses increased 20.0 percent to $228.4 million from $190.3 million in the second quarter of fiscal 2016. The increase in SG&A expenses was primarily driven by the additional expenses associated with the incremental seventeen dealerships and two Overton’s locations operated during the second quarter of 2017 versus the prior year period, $2.1 million of transaction expenses associated with the acquisition into new or complimentary markets, including the Gander Mountain Acquisition and $1.4 million of pre-opening and payroll costs associated with the Gander Mountain Acquisition. SG&A expenses as a percentage of total gross profit decreased 227 basis points to 61.3 percent, which includes the impact of the $2.1 million of transaction expenses and the $1.4 million of pre-opening and payroll costs associated with the Gander Mountain Acquisition. Depreciation and amortization expense increased 25.7 percent to $7.6 million.
Interest & Other Expenses
Floor plan interest expense increased 22.3 percent to $6.6 million from $5.4 million in the second quarter of fiscal 2016. The increase was primarily related to a 7.8 percent increase in average inventory for the second quarter 2017 compared to the prior year period, primarily due to the seventeen additional dealership locations opened over the last twelve months, partially offset by a 6 basis point decrease in the average floor plan borrowing rate. Other interest expense decreased 16.1 percent to $10.6 million from $12.6 million in the second quarter last year primarily related to a decrease in average debt outstanding, and a 91 basis point decrease in the average interest rate.
Net income increased 26.3 percent to $105.3 million and adjusted pro forma net income increased 41.6 percent to $77.7 million from $54.9 million in the second quarter of fiscal 2016. Adjusted pro forma earnings per fully exchanged and diluted share increased 38.5 percent to $0.91 from $0.65 in the second quarter of fiscal 2016.
Adjusted EBITDA
Adjusted EBITDA increased 36.0 percent to $142.1 million from $104.5 million and adjusted EBITDA margin increased 130 basis points to 11.1 percent from 9.8 percent in the second quarter of fiscal 2016.
Select Balance Sheet and Cash Flow Items
The company’s working capital and cash and cash equivalents balance at June 30, 2017 were $393.6 million and $252.2 million, respectively, compared to $266.8 million and $114.2 million, respectively, at December 31, 2016. During the quarter ended June 30, 2017, the company received proceeds, net of underwriter discounts and commissions, of $122.5 million from the sale of 4.6 million Class A shares in a public offering. At the end of the second quarter of 2017, the company had $3.2 million of borrowings under its $35 million revolving credit facility, $736.3 million of term loan principal outstanding under its senior secured credit facilities and $780.9 million of floor plan notes payable outstanding under its floor plan financing facility. Inventory at the end of the second quarter of fiscal 2017 increased 10.6 percent to $1,106.1 million compared to $909.3 million at December 31, 2016.
Photo courtesy Camping World


