Shoe Carnival Inc. sharply raised the company’s full-year guidance after reporting earnings tripled in the second quarter.
Second Quarter Highlights
• Net sales increased 14.2 percent to $268.4 million compared to the second quarter last year, with approximately $19.7 million of this increase attributable to the one-week shift in the calendar due to fiscal 2017 being a 53-week year
• Comparable store sales increased 6.7 percent
• Earnings per diluted share increased 217 percent to 76 cents
• Cash and cash equivalents were $38.4 million with no outstanding bank debt as of August 4, 2018
• Inventory was down 2.0 percent on a per-store basis
Cliff Sifford, Shoe Carnival’s president and chief executive officer, commented, “We are pleased with our strong financial results for the second quarter which exceeded our expectations. Our mid-single-digit comparable store sales increase was primarily driven by a double-digit increase in women’s non-athletic footwear, with most of our other major footwear categories up mid-single digits. This positive trend has accelerated into the back-to-school season with comparable store sales up 7.7 percent through the first three weeks of August. This sales increase was on top of a 7.0 percent increase in the full month of August last year. We believe we remain well positioned for future growth, and based on these strong operational and financial results, as well as our outlook for the remainder of the year, we are raising our annual earnings guidance.”
Second Quarter Financial Results
Net sales of $268.4 million increased 14.2 percent for the second quarter ended August 4, 2018, compared to net sales of $235.1 million for the second quarter ended July 29, 2017. Wall Street was expecting $267 million on average.
Comparable store sales increased 6.7 percent compared to the thirteen-week period ended August 5, 2017.
Gross profit margin for the second quarter of fiscal 2018 increased to 31.2 percent compared to 29.0 percent in the second quarter of fiscal 2017. Merchandise margin increased 0.2 percent and buying, distribution and occupancy expenses decreased 2.0 percent as a percentage of net sales compared to the second quarter of fiscal 2017.
Selling, general and administrative expenses for the second quarter of fiscal 2018 increased $7.0 million to $68.9 million. The increase in expense was primarily due to incentive and equity compensation as a result of the improved financial performance of the company and advertising expense to support back-to-school sales. As a percentage of net sales, these expenses decreased to 25.6 percent compared to 26.3 percent in the second quarter of fiscal 2017.
Net income for the second quarter of fiscal 2018 was $11.8 million, or $0.76 per diluted share. For the second quarter of fiscal 2017, the company reported net income of $3.9 million, or 24 cents per diluted share. Wall Street’s consensus estimate had been 57 cents.
Six Month Financial Results
Net sales during the six months ended August 4, 2018 increased $37.4 million to $525.8 million compared to the six months ended July 29, 2017. Comparable store sales for the twenty-six week period ended August 4, 2018 increased 4.0 percent compared to the twenty-six week period ended August 5, 2017.
Net earnings for the first six months of fiscal 2018 were $24.7 million, or $1.59 per diluted share, compared to net earnings of $12.1 million, or $0.73 per diluted share, in the first six months of fiscal 2017. The gross profit margin for the first six months of fiscal 2018 was 30.6 percent compared to 28.7 percent in the same period last year.
Selling, general and administrative expenses for the first six months increased $8.1 million to $128.9 million. As a percentage of net sales, these expenses decreased to 24.5 percent compared to 24.7 percent in the first six months of fiscal 2017. The company closed six stores during the first six months of fiscal 2018 compared to 12 store openings and nine store closings in the first six months of fiscal 2017.
Store Openings and Closings
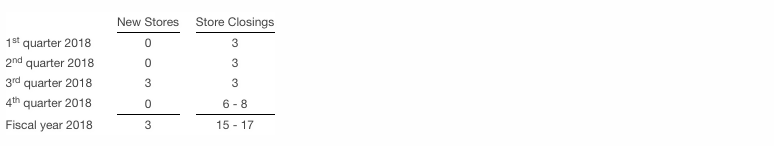
The company expects to open approximately three stores and close approximately 15 to 17 stores during fiscal 2018 compared to opening 19 stores and closing 26 stores during fiscal 2017.
Expected store openings and closings by quarter for the fiscal year are as follows:
Fiscal 2018 Outlook
The company is raising its fiscal 2018 outlook as follows:
• Net sales in the range of $1.016 billion to $1.020 billion, with comparable store sales up low single digits;
• Earnings per diluted share in the range of $2.07 to $2.15. Fiscal 2017 earnings per diluted share were $1.15 and adjusted earnings per diluted share were $1.49.
Previously, Shoe Carnival expected earnings in the range of $1.90 to $2.05 and sales in the range of $1.013 billion to $1.020 billion, with comparable store sales up low single digits.
Photo courtesy Shoe Carnival


