Camping World Holdings Inc., the parent of Gander Outdoors, reported earnings excluding special items more than doubled in the fourth quarter ended December 31 as sales grew 37.9 percent.
Fourth Quarter 2017 Summary
- Total revenue increased 32.9 percent to $889.0 million;
- Gross profit increased 37.1 percent to $266.6 million and gross margin increased 92 basis points to 30.0 percent;
- Income from operations increased 37.9 percent to $44.3 million and operating margin increased 28 basis points to 7.4 percent;
- Net loss was $52.5 million and included a $99.8 million tax receivable liability adjustment to other income and $165.4 million of income taxes related to changes stemming from the U.S. tax reform enacted in December 2017. Net loss margin was 5.9 percent and diluted earnings per share was ($1.87);
- Adjusted pro forma net income(1) increased 112.8 percent to $22.0 million and Adjusted Pro Forma Earnings per Fully Exchanged and Diluted Share(1) increased 100.0 percent to $0.25; and
- Adjusted EBITDA(1) increased 76.0 percent to $65.3 million and Adjusted EBITDA Margin(1) increased 180 basis points to 7.3 percent.
Fiscal 2017 Summary
- Total revenue increased 21.8 percent to $4.3 billion;
- Gross profit increased 25.1 percent to $1.2 billion and gross margin increased 77 basis points to 29.1 percent;
- Income from operations increased 29.4 percent to $361.4 million, and operating margin increased 50 basis points to 8.4 percent,
- Net income was $186.0 million and included a $99.7 million tax receivable liability adjustment to other income, and $165.4 million of income taxes related to changes stemming from the U.S. tax reform enacted in December 2017. Net income margin was 4.3 percent and diluted earnings per share were ($0.70);
- Diluted earnings per share(2) were($1.87), adjusted pro forma net income(1) increased 51.0 percent to $198.7 million and adjusted pro forma earnings per fully exchanged and diluted share(1) increased 45.9 percent to $2.29; and
- Adjusted EBITDA(1) increased 38.2 percent to $399.6 million and adjusted EBITDA margin(1) increased 111 basis points to 9.3 percent.
(1) Adjusted Pro Forma Net Income, Adjusted Pro Forma Earnings per Fully Exchanged and Diluted Share, Adjusted EBITDA and Adjusted EBITDA Margin are non-GAAP measures. For reconciliations of these non-GAAP measures to the most directly comparable GAAP measures, see the “Non-GAAP Financial Measures” section.
(2) Diluted earnings per Class A common stock is applicable only for periods after the company’s initial public offering. For a discussion of earnings per share see the “Earnings Per Share” section.
Marcus Lemonis, chairman and chief executive officer, stated, “We had a very strong fourth quarter and fiscal year and are pleased with the continued performance of our business and underlying trends in the RV market. Demand for towable and smaller recreational vehicles remained strong throughout 2017, and we made the strategic decision to carry a little more inventory in order to drive volumes and gain market share in the final months of the year. This decision paid off and we generated record fourth quarter revenue and Adjusted EBITDA. In the fourth quarter, revenue increased 33 percent to $889 million, Adjusted Pro Forma Net Income increased 113 percent to $22 million and Adjusted EBITDA increased 76 percent to $65 million.”
Lemonis continued, “The trends that we have been talking about for the past year remain strong and continue to drive our business. Our focus on towables and the lower priced segment of the RV market allows us to sell to a much wider and more diverse group of consumers than ever before. We see a lot of similarities between the outdoor consumer and the RV consumer, and we believe there is a significant opportunity to continue diversifying our business as these lifestyles converge. Over the past year, we have acquired a number of outdoor and active sports businesses that give us access to a more diverse base of outdoor lifestyle customers. Overton’s, Gander Outdoors, TheHouse.com, Uncle Dan’s, W82 and Erehwon all come with great talent, great products and a loyal customer following that we believe we can leverage over time through cross-selling and cross-promotions. We began opening our first Gander Outdoors stores in December 2017 and are pleased with the early trends, including Good Sam Club conversion rates at these stores.”
Fourth Quarter 2017 Results Compared to Fourth Quarter 2016 Results
Units and Average Selling Prices
The total number of recreational vehicle units sold increased 36.1 percent to 18,117 units from 13,316 units and the average selling price of a unit decreased 4.6 percent to $33,031 from the fourth quarter of 2016. New vehicle units sold increased 50.4 percent to 12,013 units and the average selling price of a new vehicle decreased 8.4 percent to $38,163. Used vehicle units sold increased 14.5 percent to 6,104 units and the average selling price of a used vehicle decreased 4.9 percent to $22,930.
Revenue
Total revenue increased 32.9 percent to $889.0 million from $668.9 million in the fourth quarter of 2016. Consumer Services and Plans revenue increased 4.5 percent to $51.1 million and Retail revenue increased 35.1 percent to $837.9 million. In the Retail segment, new vehicle revenue increased 37.8 percent to $458.5 million, used vehicle revenue increased 9.0 percent to $140.0 million. Parts, services and other revenue increased 48.4 percent to $174.7 million and finance and insurance revenue increased 57.3 percent to $64.8 million. Included in the parts, services and other revenue was $38.2 million in sales from the Outdoor and Active Sports Retail businesses acquired in 2017, including Gander Outdoors, Overton’s, TheHouse.com, Uncle Dan’s and W82. Finance and insurance, net revenue as a percentage of total new and used vehicle revenue, increased to 10.8 percent from 8.9 percent in the fourth quarter of 2016.
Same store sales for the base of 115 retail locations that were open both at the end of the corresponding period and at the beginning of the preceding fiscal year increased 11.9 percent to $655.3 million for the three months ended December 31, 2017. The increase in same-store sales was primarily driven by a 18.6 percent increase in new vehicle same-store sales, a 34.0 percent increase in finance and insurance same-store sales and a 3.0 percent increase in parts, services and other same-store sales, partially offset by a 4.9 percent decrease in used vehicle same-store sales.
The company operated a total of 140 Camping World retail locations, two Overton’s locations, two TheHouse.com locations, two Gander Outdoors locations, two W82 locations and five Uncle Dan’s locations as of December 31, 2017, compared to 122 Camping World retail locations at December 31, 2016.
Gross Profit
Total gross profit increased 37.1 percent to $266.6 million, or 30.0 percent of total revenue, from $194.5 million, or 29.1 percent of total revenue, in the fourth quarter of 2016. On a segment basis, Consumer Services and Plans gross profit increased 8.2 percent to $31.1 million, or 60.8 percent of segment revenue, from $28.7 million, or 58.7 percent of segment revenue, and Retail gross profit increased 42.1 percent to $235.5 million, or 28.1 percent of segment revenue, from $165.8 million, or 26.7 percent of segment revenue, in the fourth quarter of 2016. A 211-basis-point improvement in Consumer Services and Plans gross margin was primarily driven by increased file size of our membership clubs combined with reduced club marketing expense, and increased contracts in force in our roadside assistance programs combined with reduced program costs. A 137 basis point increase in Retail gross margin was primarily driven by an increase in the finance and insurance, net revenue as a percentage of total new and used vehicle revenue to 10.8 percent of vehicle sales from 8.9 percent of vehicle sales in the fourth quarter of 2016, and the 50.4 percent increase in new units sold.
Operating Expenses
Operating expenses increased 36.9 percent to $222.3 million from $162.4 million in the fourth quarter of 2016. Selling, general and administrative (“SG&A”) expenses increased 37.5 percent to $213.1 million from $154.9 million in the fourth quarter of 2016. The increase in SG&A expenses was primarily driven by the additional expenses associated with the incremental 26 greenfield and acquired retail locations opened during 2016 and 2017, two Overton’s locations, two TheHouse.com locations, two Gander Outdoors locations and two W82 locations operated during the fourth quarter of 2017 versus the prior year period, $17.7 million of pre-opening and payroll costs associated with the Gander Mountain acquisition and $0.1 million of transaction expenses associated with the acquisition into new or complimentary markets. As a percentage of total gross profit, SG&A expenses increased 25 basis points to 79.9 percent compared to the fourth quarter of 2016. Depreciation and amortization expense increased 33.2 percent to $8.7 million, primarily due to the addition of acquired and greenfield locations and acquired businesses.
Floor Plan Interest & Other Interest Expenses
Floor plan interest expense increased to $8.4 million from $4.0 million in the fourth quarter of 2016. The increase was primarily attributable to higher inventory from new dealership locations and locations expecting higher unit sales, as well as a 84 basis point increase in the average floor plan borrowing rate. Other interest expense increased to $12.0 million from $10.3 million in the fourth quarter of 2016. The increase was primarily attributable to an increase in average debt outstanding, partially offset by an 86-basis-point decrease in the average interest rate.
Net Loss, Net loss margin, Adjusted Pro Forma Net Income(1), Diluted Earnings Per Share and Adjusted Pro Forma Earnings Per Fully Exchanged and Diluted Share(1)
Net loss was $52.5 million, reflecting a $99.8 million tax receivable liability adjustment to other income and $165.4 million of income tax expense related to changes stemming from the U.S. tax reform enacted in December 2017, among other things. Net loss margin was (5.9 percent), and diluted earnings per share were ($1.87).
Adjusted pro forma net income(1) increased 112.8 percent to $22.0 million from $10.3 million and adjusted pro forma earnings per fully exchanged and diluted share(1) increased 100.0 percent to $0.25 from $0.12 in the fourth quarter of 2016.
Adjusted EBITDA and Adjusted EBITDA Margin(1)
Adjusted EBITDA(1) increased 76.0 percent to $65.3 million and adjusted EBITDA margin(1) increased 180 basis points to 7.3 percent from 5.5 percent in the fourth quarter of fiscal 2016.
Select Balance Sheet and Cash Flow Items
The company’s working capital and cash and cash equivalents balance at December 31, 2017 were $478.7 million and $224.2 million, respectively, compared to $257.7 million and $114.2 million, respectively, at December 31, 2016. At the end of the fourth quarter 2017, the company had $3.2 million of letters of credit outstanding under its $35 million revolving credit facility, $916.9 million of term loan principal outstanding under its senior secured credit facilities and $974.0 million of floor plan notes payable outstanding under its floor plan financing facility. Inventory at the end of the fourth quarter of fiscal 2017 increased 56.9 percent to $1,415.9 million compared to $902.7 million at December 31, 2016.
Reclassifications and Revisions to Prior Periods
Certain revisions have been recorded in prior periods to correct for errors that were immaterial to previously-reported consolidated financial statements. In connection with the preparation of the financial statements for the year ended December 31, 2017, errors were identified relating to i) the lack of deferral of a portion of Good Sam roadside assistance policies sold through the finance and insurance process with the sale of new and used vehicles, ii) the application of a portion of certain vendor rebates against the related inventory balances, iii) the elimination of the inter-company allocation of certain revenue from new and used vehicles to consumer services and plans and iv) the allocation of the inter-company markup between costs applicable to new and used vehicles.
To quantify these errors, management performed an analysis of deferred roadside assistance policies and vendor rebates applicable to ending inventory for each period presented. The company evaluated the materiality of these errors both qualitatively and quantitatively in accordance with the Securities and Exchange Commission’s Staff Accounting Bulletin (“SAB”) No. 99 – Materiality, and SAB No. 108 and concluded that the impact of these errors on the company’s previously-issued consolidated financial statements was not material. To enhance comparability and transparency, the company has revised its previously-reported consolidated financial statements for the years ended as of December 31, 2016 and 2015, to correct for these errors. As a result of these revisions, new vehicles revenue, used vehicles revenue, finance and insurance, net revenue, costs applicable to revenue–new vehicles, costs applicable to revenue–used vehicles, all within the retail segment, and net income attributable to non-controlling interests and earnings per share, basic and diluted, were corrected, as presented in the table below.
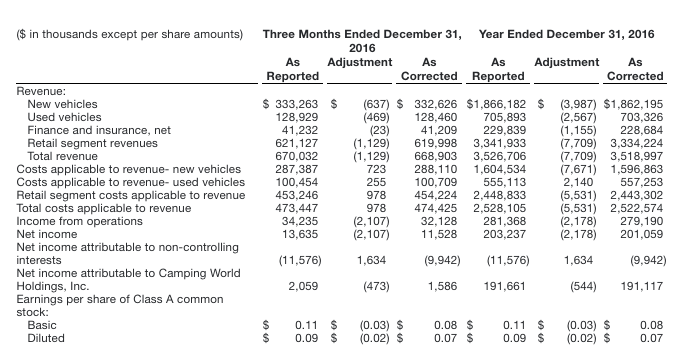
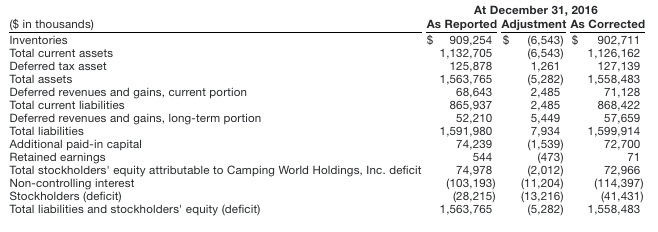
Additionally, as a result of these errors, the cumulative effect of the change on stockholders’ /members’ deficit as of January 1, 2015, the earliest date presented in these consolidated financial statements, was $8.1 million, resulting in an as-corrected amount of $250.7 million, as compared to $242.6 million reported previously. Prior year inventories, deferred tax asset, deferred revenues and gains, current and long-term portion, additional paid-in capital, retained earnings and non-controlling interest on the consolidated balance sheets were each corrected as follows:
Since the company’s founding in 1966, Camping World has grown to become one of the most well-known destinations for everything RV, with 140 retail locations in 36 states and comprehensive e-commerce platform. Its banners include Camping World, Gander Outdoors, Good Sam, Overton’s, TheHouse.com, Uncle Dan’s, W82 and Erehwon.


